
Look-Ahead Bias: Why Your Backtest Beats the Live Market

A backtest that cannot lose is usually not a discovery. It is a reading error. Somewhere in the loop, the strategy was handed a price that did not exist yet at the moment it decided to trade, and every decision after that was made with an advantage no live account can reproduce.
That fault has a name. It is look-ahead bias, and on a trading platform it rarely arrives as a coding mistake. It arrives through a setting, an index, or a timeframe that finished later than the bar being tested.
Key takeaways
- Look-ahead bias means a rule consumed something nobody could have known when it fired. What settles it is the timestamp of the decision, never the timestamp of the data.
- On MetaTrader the most common entry point is not code at all. It is bar index zero, which the MQL4 reference defines as a shift relative to the current bar, and the current bar is the one still forming.
- The MQL5 documentation lists three generated tick modes for the MetaTrader 5 tester: Every tick, 1 Minute OHLC, and Open prices only. Coarser modes give a strategy fewer decision points inside the bar, which changes what a rule can and cannot have seen.
- Look-ahead bias, indicator repainting and overfitting produce three different symptoms and need three different remedies. Treating them as one problem is why the wrong fix gets applied.
- Future data can be found without reading a line of code, by comparing the same strategy under two tick modes and on two data windows.
Table of contents
- What Counts as Future Data at the Moment of a Decision
- The Platform Case: Index Zero Is the Bar That Has Not Finished
- Tick Generation Modes, and What Each One Hides
- Look-Ahead, Repainting and Overfitting Are Three Different Faults
- Where a Higher Timeframe Value Arrives Early
- Which Symptom Points at Which Fault
- Five Checks That Find Future Data Without Reading the Code
- Who This Page Is Not For
What Counts as Future Data at the Moment of a Decision
Every rule in a strategy fires at an instant. Look-ahead bias is present when the inputs to that rule include anything that was only knowable after it. The measure is not whether the data is old. Data from four years ago is future data if the decision it fed was made four years and one minute ago.
The distinction matters because most explanations of this fault are written for people building datasets, where the classic case is a company financial figure stamped with the quarter it describes rather than the date it was published. A trader running rules on price bars meets a narrower and more mechanical version of the same problem, and it has almost nothing to do with datasets.
Three things carry it into a price-based test. A bar that has not closed but is being read as though it had. A value computed on a slower timeframe that only became final after the faster bar being tested. And a fill assumption that gives the order a price the market printed later in the same bar.
None of the three requires a mistake in the trading logic. Each is a property of how the test was configured, which is why a backtest of a trading strategy can be arithmetically perfect and still describe a market that never existed.
The result is always the same shape. The equity curve is smooth, the win rate is implausible, and the strategy stops working the moment it runs forward on data nobody has seen.
The Platform Case: Index Zero Is the Bar That Has Not Finished
On MetaTrader the price series is indexed backwards from now. The MQL4 reference defines the shift parameter of iClose as the index of the value taken relative to the current bar, counted the given number of periods ago. Index one is the bar before the current one, index two the bar before that, and index zero is the current bar.
The current bar is not finished. Its close price is whatever the last tick happened to be, and it will keep changing until the period ends. A rule that compares a moving average against the close at index zero is comparing it against a number that has not settled.
Read live, that is merely noisy. Read inside a tester, it can become look-ahead bias, because the tester already holds the whole bar. Whether the rule sees a settled close or an unsettled one depends entirely on how many decision points the tester generates inside that bar, which is a setting rather than a property of the strategy.
This is the reason the same expert advisor can produce two different results on identical data with no change to its logic. Nothing about the rules changed. What changed is when the rules were asked, and therefore how much of the bar had already happened when they were.
The habit that removes the whole class is to write every rule against a bar that has closed, and to accept the delay that comes with it. A signal read at index one is a signal that arrives one bar late and is real. A signal read at index zero arrives instantly and may not survive the bar.
Tick Generation Modes, and What Each One Hides
The MQL5 documentation describes three modes of tick generation in the MetaTrader 5 strategy tester: Every tick, 1 Minute OHLC, and Open prices only. Every tick is described there as the basic and most detailed mode, with the other two presented as simplifications of it.
In the 1 Minute OHLC mode the tick sequence is constructed only from the open, high, low and close prices of the minute bars, which the documentation notes significantly reduces the number of generated control points.
Fewer control points means fewer moments at which the strategy is asked for a decision. A rule that would have fired mid-bar under a dense tick sequence may only be asked once the bar has already moved, and the price it then receives is one the live market reached later than the rule would have acted.
The documentation also describes testing on real ticks, where ticks accumulated by a broker from exchanges and liquidity providers replace generated ones. Minute bars are still used in that mode to check and correct the tick data, and the tester compares ticks against the bar parameters so that a tick does not exceed the high or low of its bar. The tester tick cache is documented as not exceeding 128,000 ticks.
None of this is a defect in the platform. It is a documented set of trade-offs between speed and fidelity. It becomes look-ahead bias only when a strategy is written against one mode and then read as though the result held under all of them, and the documentation treats bar synchronisation under Open prices only as a distinct topic for exactly that reason.
Look-Ahead, Repainting and Overfitting Are Three Different Faults
These three get discussed as one family, and the confusion is expensive because each has a different remedy. Applying the wrong one leaves the original fault in place and adds a second.
| Fault | What went wrong | Where it shows up first | What actually fixes it |
|---|---|---|---|
| Look-ahead bias | The decision used data that was not final yet | A test result that collapses the moment it runs forward | Move every rule onto closed bars and retest |
| Repainting | The drawing changes after the fact on the chart | Past signals differ after a reload or timeframe change | Record the signal when it fires and compare later |
| Overfitting | Too many parameters fitted to one sample | A gradual decay on data outside the fitted window | Fewer parameters, and an untouched holdout window |
The separation is practical rather than academic. Repainting indicators are a display problem that a recorded signal log will expose in an afternoon. Overfitting is a sample-size problem that only a holdout window can answer. Look-ahead bias is a timing problem, and no amount of extra data will reveal it, because the extra data will be read with the same fault.
Where a Higher Timeframe Value Arrives Early
A rule that reads a daily value while trading a five-minute chart has to answer one question: on the five-minute bar being tested, had that daily bar closed? For most of the trading day, it had not. Requesting the daily close at that moment returns a figure that will not be settled for hours.
This is the least visible form of the fault, because the code looks careful. It asks for a completed higher timeframe bar, and it uses an index that would be correct if the day were over. On the last bar of the session the request is honest. On every earlier bar it is not.
The version that survives contact with a live account uses only the previous completed higher timeframe bar, whatever time of day the lower timeframe bar falls on. That costs a day of freshness, and it is the reason a well-built multi-timeframe analysis setup produces a duller backtest than a careless one.
The same reasoning applies to any input published on a slower clock than the one being traded. A weekly level, a session range, an economic figure released mid-session: each is available only after its own period has ended, and a test that ignores that boundary is measuring a strategy nobody could have run.
Which Symptom Points at Which Fault
Three symptoms separate the three faults reliably enough to start from, and each takes one test rather than a rebuild.
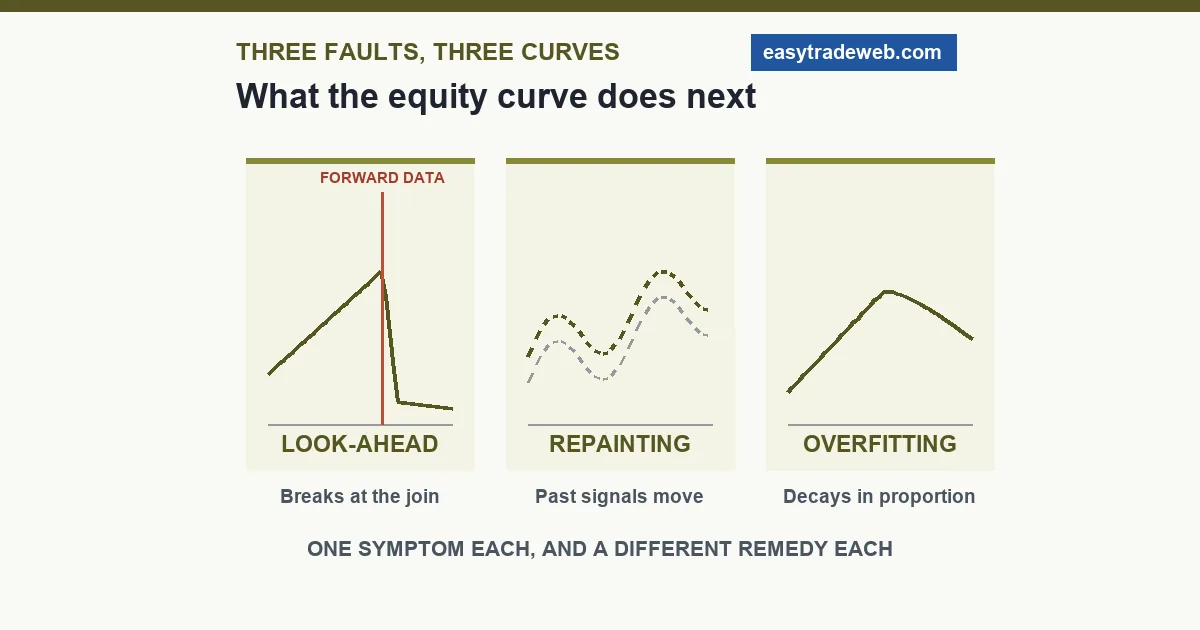
An equity curve that is close to a straight line in-sample and turns over immediately on forward data points at look-ahead bias. The break is abrupt rather than gradual, and it lands exactly where the untested data begins. Overfitting decays; future data falls off a cliff.
Signals that were on the chart yesterday and are not there today point at repainting, not at either of the others. Nothing about the test changed, only the redraw, and a signal log written at the moment of firing settles it.
A strategy that works out of sample but worse, in proportion to how many parameters were tuned, points at overfitting. Performance degrades smoothly rather than breaking, and the degradation tracks the number of things that were optimised. That pattern also shows up in performance records selected after the fact, which is the mechanism behind survivorship bias in published results.
Five Checks That Find Future Data Without Reading the Code
Each of these compares a strategy against itself under one changed condition. Nothing here requires access to the source.
- Run the same test under a dense tick mode and a coarse one. A result that improves as the mode gets coarser is reading inside bars it should not see, because coarser modes offer fewer honest decision points and more chances to act on a bar that has already moved.
- Shift the whole test window forward by one bar and rerun. A genuine edge moves with it. A rule anchored to a specific end point does not.
- Compare the entry prices in the report against the high and low of the bars they fell in. Fills sitting repeatedly at the extreme of a bar in the favourable direction are not execution luck.
- Split the data at a date chosen before any optimisation, and run the second half once. A first run on untouched data is the only run that means anything; every run after it has been contaminated by what was learned from the first.
- Compare the closed-bar version of the rule against the current-bar version. If the closed-bar version is materially worse, that difference is the size of the advantage the test was taking from unfinished bars.
Who This Page Is Not For
Anyone testing a discretionary approach by hand will not meet this fault in the form described here, because a human reading a chart already knows which bar has closed. The relevant risk there is hindsight, which is a different problem with a different remedy.
Risk warning: this page is educational and explains how a testing fault arises and how to detect it. It is not advice to buy or sell any instrument, it recommends no product, platform or broker, and nothing here is a signal, a performance claim or a prediction. Past or simulated performance figures do not indicate future results, and leveraged trading carries a high risk of losing money.