
The McClellan Oscillator: Which Scale Your Reading Is On

The McClellan Oscillator turns one daily count into one number. It takes the stocks on an exchange that closed higher and the ones that closed lower, and tracks how the gap between those two counts is moving.
The number it prints has no fixed size. Two charts of this indicator, drawn from the same exchange on the same day, can sit on scales that differ by an order of magnitude, because of a setting neither chart is obliged to show. The overbought and oversold levels in circulation reflect that, and they disagree.
What follows is a reading of which quantity each published level actually belongs to, and how to work out which scale the chart in front of you is drawn on.
Key takeaways
- Platform documentation describes two calculation modes for this indicator, simple and ratio-adjusted, and the mode is a setting the user chooses rather than a property of the indicator.
- The ratio-adjusted mode divides the difference between advancing and declining issues by their sum and multiplies by 1000, which bounds the input at plus or minus 1000 whatever the exchange. The simple mode has no such bound.
- The string ratio-adjusted appears nine times in one of the four readable explanations and three times in the platform documentation, and zero times in the other two, one of which prints a bare overbought level.
- The levels of 1000 to 1250 that circulate for this indicator are attached, on the page that states them, to the Summation Index, which is a different series.
- The site of the originators returned an access refusal to every retrieval attempt made here, so no level on this page is presented as authoritative.
- The 19 and 39 day averages are the pair whose exponential smoothing constants come out at 10 per cent and 5 per cent exactly.
Table of contents
- The Input, and Why Its Size Is Not Fixed
- The Threshold You Read and the Chart You Read It On
- Two Calculation Modes, and Which One Your Platform Used
- Why the Adjustment Exists: the Listing Count Moved
- The 19 and 39 Day Averages, and What They Do Not Fix
- What a Divergence Can and Cannot Say Here
- Which of These Readings Applies to You
The Input, and Why Its Size Is Not Fixed
The raw input is a subtraction. Take the number of issues on one exchange that finished the session higher, subtract the number that finished lower, and that difference is what the indicator is built from. Everything after that step is smoothing.
Two things about that difference are decided outside the formula. The first is which exchange the counts come from. Platform documentation for this study exposes the exchange as a parameter the user sets, alongside the averaging lengths and the two levels drawn on the chart, so the same study on the same screen produces different numbers depending on a dropdown.
The second is how many issues that exchange lists. A market with more listed issues can produce a larger raw difference from the same proportional split of winners and losers. A day on which 60 per cent of issues rise yields a bigger raw number on a market of 3,000 issues than on a market of 2,000, and nothing about the second market is calmer.
That is the whole reason a scale question exists at all here. If you want the wider picture of what market breadth counts and where the underlying advance and decline data comes from, that page covers it, and it is also the page that answers whether any breadth reading exists for a currency pair. This one stays on the scale problem.
The Threshold You Read and the Chart You Read It On
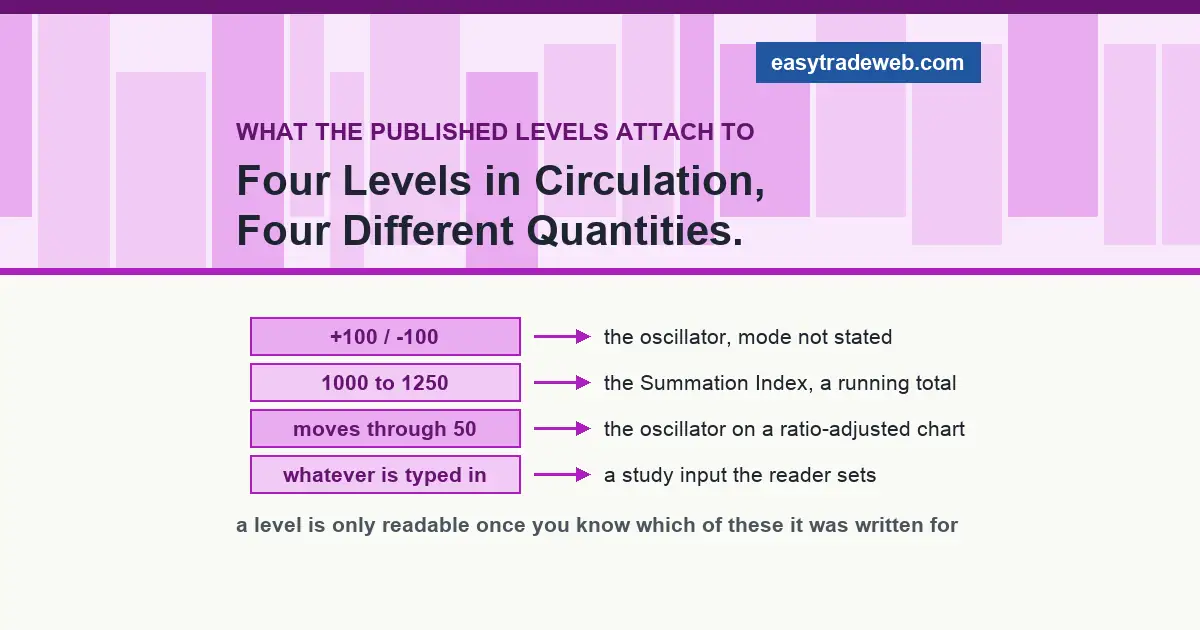
Four descriptions of this indicator could be read for this page. Between them they put four different level regimes into circulation, and not one of them states which quantity its numbers are attached to.
The consequence is specific rather than theoretical. Someone reading a level on one page and then applying it to a chart drawn elsewhere is not off by a rounding error. They may be applying a level from a running cumulative total to a chart of a daily oscillator, which is a different series with a different range.
| Level as published | Quantity it is attached to | Scale that quantity sits on | Source given for the level |
|---|---|---|---|
| Plus or minus 100 (TradingView explainer) | The oscillator itself | Not stated, because the mode is never mentioned | None |
| 1000 to 1250, and the negative mirror (Wikipedia) | The Summation Index, a running total, not the oscillator | A cumulative series, unbounded by construction | Attributed to McClellan Publications |
| Moves through 50, with 100 treated as a large swing (StockCharts ChartSchool) | The oscillator on a ratio-adjusted chart | Ratio-adjusted, multiplied by 1000 | None |
| Whatever value is typed in (thinkorswim study) | The oscillator in either mode | Whichever mode the user selected | The user, as a study input |
The last row is the one worth sitting with. On that platform the overbought and oversold levels are inputs, described as fixing where the lines are drawn. They are a preference the reader supplies, not a measurement the indicator returns.
One further gap in the evidence should be stated plainly. The site of McClellan Financial Publications, run by the family that developed the indicator, returned an access refusal to every retrieval attempt made for this page. The original statement of the levels could not be read here, so no number above is repeated as authoritative, and every one is reported as belonging to the page that prints it.
Two Calculation Modes, and Which One Your Platform Used
Platform documentation for this study sets out two ways of preparing the breadth input, One of them is named simple, and it leaves the input as the plain difference between the advancing and declining counts. The other is named ratio-adjusted, and it divides that difference by the sum of the same two counts before multiplying the result by 1000.
The division is what changes the arithmetic. A difference divided by the sum of the same two counts cannot exceed 1 or fall below minus 1, so multiplying by 1000 produces an input that stays inside plus or minus 1000 on any exchange of any size. The bound is a property of the formula, not of the market.
The simple mode carries no bound of that kind. Its ceiling on a given day is however many issues traded and moved, which is why a level that means an extreme reading on one market can be an ordinary session on a larger one.
Two of the four readable descriptions never mention that a mode exists. Measured across the retrieved files, the phrase ratio-adjusted appears nine times in one explanation and three times in the platform documentation, and zero times in the other two. One of those two is the page printing a bare level of plus or minus 100. A reader working from it is choosing a scale without being told a choice was made.
This is the same failure that shows up wherever one name covers several published series, and it is worth checking which series you are reading before importing any level into a chart, on this indicator or another.
Why the Adjustment Exists: the Listing Count Moved
The ratio adjustment exists because the raw counts are tied to how many companies are listed, and that figure has moved a long way. World Bank data on listed domestic companies in the United States, an indicator series last updated on 13 July 2026, puts the total at 6,429 in 1990, a peak of 8,090 in 1996 and 4,317 in 2023.
That is a fall of close to half from the peak. A raw difference between advancing and declining issues, taken in 1996 and taken in 2023, is drawn from populations of very different size, so the two numbers are not comparable even before anything is smoothed.
Two limits on that figure need stating. It counts domestic companies listed across United States exchanges, which is not the same quantity as the issues counted in a single exchange advance and decline feed, and it is annual rather than daily. It settles the direction and the rough size of the move, and nothing finer.
The per-exchange issue counts that circulate in explanations of this indicator carry no source on the pages that state them, so they are not repeated here. The point they are used to support survives without them: the population being counted has changed enough that a level calibrated on one era does not carry over to another, which is what the division is there to fix.
The 19 and 39 Day Averages, and What They Do Not Fix
Once the breadth input is prepared, the indicator is the difference between a fast and a slow exponential moving average of it. Platform documentation exposes both lengths as parameters, so the familiar 19 and 39 day pair is a default rather than part of the definition.
Those two lengths are not arbitrary. An exponential moving average of length n carries a smoothing constant of 2 divided by n plus 1. For 19 that comes out at 0.10 exactly, and for 39 at 0.05 exactly, so the pair is the one that gives round weightings of 10 per cent and 5 per cent on the newest value.
Taking the difference between two averages of one series removes the level and leaves the change, which is why a market with a persistent mild upward bias in its breadth counts does not simply park the oscillator above zero forever. That much the smoothing does fix.
What it does not fix is the scale. Both averages are measured in the units of whatever input they were fed, so their difference is in those units too. Switching the mode changes the units of the answer while the chart keeps the same name, the same shape and often the same drawn levels. That distinction between what a calculation removes and what it leaves untouched is the same one behind what the labels really mean on any smoothed indicator.
What a Divergence Can and Cannot Say Here
A divergence compares the direction of the oscillator with the direction of the index whose issues it counts. Because it is a comparison of directions rather than of values, it is the one reading on this page that survives a change of mode. Both modes turn the same underlying session up or down, so the shape holds even when the numbers do not.
What the comparison cannot supply is a size or a date. A divergence states that two series stopped agreeing, and stops there.
There is also a construction problem that sits underneath every such comparison. A capitalisation-weighted index and a breadth reading built from equally counted issues answer different questions about the same session, so they can separate for reasons that are arithmetic rather than a warning about anything.
A handful of very large constituents can carry an index on a day when most issues fall, and the two lines will part company exactly as they would if something were changing underneath.
Reading one series against another is a general problem rather than one belonging to this indicator, and our page on which correlations hold up works through what has to be true before two series can be compared at all.
Which of These Readings Applies to You
Which part of the above matters depends on where your chart came from, and there are three cases worth separating.
If your platform exposes a ratio-adjusted setting, the mode is yours and you can read it directly. Check the state of that setting before importing any level from anywhere, and note that changing it later renews the question rather than settling it.
If you are reading a vendor symbol that publishes a finished oscillator series, the mode was decided for you and it is worth finding out from the vendor which one was applied, because the drawn levels usually arrive with the symbol.
If you are taking a level from an article, the first question is which quantity that level was written about. A number written for a cumulative summation series and a number written for a daily oscillator look identical on the page and describe different things.
And if the instrument in front of you is a currency pair, none of the three applies, for reasons set out on our page about market breadth indicators rather than here.
Risk notice. This page is educational. It sets out how published descriptions of one breadth indicator differ from one another, and on what. Nothing here is a recommendation to buy or sell any instrument, no level described is a forecast, and no expected result is stated or implied. Leveraged trading carries a high risk of loss.