
Presidential Cycle Theory: Does It Hold Up in Currencies?

Search for the presidential cycle and every page that comes back is about shares. The charts plot an equity index, the tables report equity returns, and the conclusion is about equities.
Readers do not always stop there. Google suggests presidential cycles and exchange rates as a completion, which means the question is being asked about currencies by people the equity pages never answer.
This page separates the two. It sets out what the four-year claim actually says, what body of data it was drawn from, why a currency is not the instrument that data describes, and how many observations the whole idea rests on once the arithmetic is done.
Key takeaways
- The theory maps the four years of a United States presidential term onto a pattern of market returns, weakest early and strongest in the third year.
- It was built on equity index data. One forex site does extend it to currency pairs with a backtest of its own, and that backtest covers nine presidencies.
- A four-year cycle produces one observation per term. A century of history supplies about 25 of them, and the currency version of the claim rests on nine.
- The channels that move a currency around an election are already named and already tracked: the expected path of policy rates, the fiscal outlook, and the risk appetite that follows both.
- A pattern measured in years cannot be acted on by an account that holds positions for days. That mismatch, not the strength of the evidence, is what rules the theory out for most readers.
- The test that transfers to any calendar claim is to ask what was measured, on which instrument, over how many independent observations.
Table of contents
- What Presidential Cycle Theory Claims
- Where the Claim Comes From, and What It Was Measured On
- Equities Are Not Currencies: What the Evidence Does and Does Not Cover
- The Channels That Already Explain Dollar Moves Around an Election
- Sample Size: Why a Four-Year Pattern Has So Few Observations
- Who This Is Not For
- How to Test Any Calendar Claim Before You Trade It
- Frequently Asked Questions
What Presidential Cycle Theory Claims
The claim is that a market moves in step with the political calendar rather than only with its own drivers. A United States presidential term runs four years, and the theory assigns each of those years a character.
The first two are the weak half, on the reasoning that an administration takes unpopular decisions early. The third is the strong one, as policy turns supportive before the next election. The fourth sits between them.
Stated that way it is a story about incentives, and the story is the part that travels. It is easy to repeat, and it survives without anyone checking whether the returns behind it were measured on the instrument the reader is holding.
The reasoning also assumes a policy channel that a reader can already watch directly rather than infer from a calendar. What an administration is expected to do to spending and what the central bank is expected to do to rates are both published, and the rate path the market is actually pricing is updated several times a year rather than once a term.
Where the Claim Comes From, and What It Was Measured On
The evidence base is a series of United States equity index returns sorted into four buckets by year of term, then averaged. That is the whole method. It is arithmetic on a long price history, not a model with a mechanism inside it.
Two things follow from that, and both matter more than the averages themselves.
The first is that the result describes rather than explains. Sorting any series by a repeating label produces four numbers, and four numbers always differ. Nothing in the procedure shows the label caused the difference; the incentive story is offered afterwards to fill that gap.
The second is that the instrument is fixed by the data. The buckets were filled with equity returns, so whatever the averages show is a statement about equities. Extending it to another asset class means redoing the work on that asset class.
One forex site has redone it, and what it produced is the most useful thing on the subject: a backtest of currency pairs across nine presidencies over a test window ending in 2012, reporting profit figures for a cycle-timed strategy against simply holding the pair. The site states plainly that nine data points are not enough to support the party-based version of the conclusion, then prints the profit figures at the top of the page anyway.
Equities Are Not Currencies: What the Evidence Does and Does Not Cover
A share price and an exchange rate are not two versions of one thing, and the difference decides whether an equity pattern can carry across.
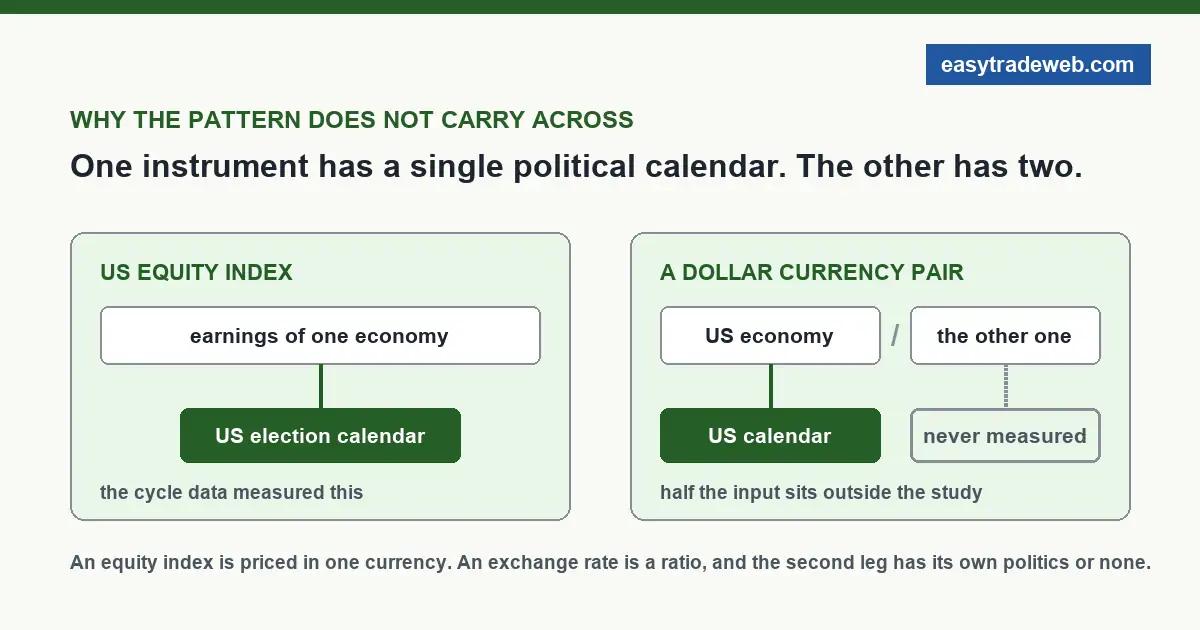
An equity index is priced in one currency and reflects the earnings of companies inside one economy. Domestic policy that helps those earnings pushes the index one way, which is the channel the cycle story leans on.
An exchange rate is a ratio between two economies and has no level of its own to rise. The same policy that supports a national equity index can push its currency either way, depending on what the other side of the pair is doing at that moment, and that side has its own election calendar or none at all.
So a four-year United States pattern applied to a currency pair is being applied to an instrument where half the input is not American. Nothing in the equity data speaks to that half, and the one currency backtest that exists carries a sample small enough that its own author warns against leaning on it.
| Question | US equity index | A dollar currency pair |
|---|---|---|
| What is being priced | Earnings of companies in one economy | One economy measured against another |
| How many political calendars apply | One | Two, and they rarely align |
| Covered by the cycle data | Yes, this is what was measured | Only in one site backtest of nine presidencies |
The Channels That Already Explain Dollar Moves Around an Election
An election does move currencies, and none of that requires a four-year cycle to describe it. Three channels do the work, and each one is observable on its own schedule.
The first is the expected path of policy rates. A currency responds to what rates are expected to do relative to the other side of the pair, and expectations move on data and central bank communication rather than on a term calendar.
The second is the fiscal outlook. A change of administration can change the expected path of borrowing and spending, and that reaches a currency through growth and inflation expectations. It is why a policy environment such as the conditions that override a calendar matters more to a currency than which year of a term it happens to be.
The third is direct action on the currency itself, which is rare, announced, and nothing to do with the cycle. Our page on when a government acts on its currency directly covers what that looks like and how it is signalled.
All three are watchable in real time. A cycle claim asks a reader to substitute a calendar for them, which is a worse instrument for the job.
Sample Size: Why a Four-Year Pattern Has So Few Observations
This is the arithmetic the charts do not print.
A presidential term lasts four years, so a complete cycle yields exactly one observation. One hundred years of history therefore contains about 25 of them. That is the entire sample behind the claim, before it is divided further.
Now take a single-year claim, such as the third year being the strong one. Each cycle contributes one third year, so that claim rests on about 25 data points in a century, drawn from an economy that changed beyond recognition across them.
The currency version is thinner still. The one backtest that runs the exercise on exchange rates covers nine presidencies, which is nine observations for a claim about how a four-year political pattern moves a two-sided instrument.
Twenty-five observations is a small number for anything, and it is a very small number for a series as noisy as market returns. A pattern that size can appear and disappear on the addition of two or three cycles, which is not a defect in how the sorting was done. It is a limit on what any amount of careful sorting could establish.
None of that makes the averages wrong. It makes them fragile, and a fragile average presented as a rule is how a position gets held for a reason the next decade of data will not support.
Who This Is Not For
The cleanest objection to trading this theory is not statistical. It is that the pattern and the reader operate on different clocks.
A four-year cycle expresses itself over years. Acting on it means holding an exposure for a substantial part of a term and accepting every drawdown inside that span, financed the whole way. Most retail accounts hold positions for days, and an account structured that way has no mechanism for expressing a multi-year view at all.
It is also unsuited to anyone whose position size is set by a recent price range, because a stop distance derived from a week says nothing about a horizon measured in years, and position sizing over a long horizon is a different calculation from the one most guides teach.
And it does not suit a reader who wants a currency answer, for the reason the whole page has been making: the evidence is about a different instrument, and no amount of confidence in the equity result transfers the finding across.
How to Test Any Calendar Claim Before You Trade It
The presidential cycle is one member of a family that includes seasonal effects, day-of-week effects and month-of-year effects. Four questions sort the family quickly.
Ask what instrument the claim was measured on, and whether it is the one you intend to trade. Ask how many independent observations the sample holds once the period is divided by the length of the cycle. Ask what mechanism is proposed, and whether that mechanism is observable directly on a shorter schedule. Ask whether the claim survives on the second half of the data as well as the first.
A claim that answers all four is worth reading on. A claim that fails the first is not about your market at all.
Frequently Asked Questions
What is the presidential cycle in markets?
It is the claim that market returns follow the four years of a United States presidential term, with the early years described as the weak half and the third as the strong one. The pattern comes from sorting a long series of equity index returns into four buckets by year of term and averaging each. The reasoning offered is that an administration takes difficult decisions early and supportive ones later.
Does the presidential cycle apply to currencies?
The evidence behind it was measured on equity indices, and none of the readable pages on the subject repeats the work on exchange rates. A currency pair is a ratio between two economies, so half of what prices it sits outside the United States and outside anything the equity data describes. Treating the equity result as a currency result is an assumption rather than a finding.
How many observations does the four year cycle rest on?
One per complete term, which is one every four years. A century of history therefore supplies roughly 25 complete cycles, and a claim about a single year of the term rests on roughly 25 data points spread across an economy that changed enormously over that span. That is a small sample for a series as noisy as market returns, which is why such a pattern can weaken or reverse as a few more cycles are added.
Is the presidential cycle the same as seasonality?
They belong to the same family of calendar claims but differ in period. Seasonal effects repeat within a year and therefore accumulate many observations quickly. A four-year cycle accumulates one observation per term, so it reaches a usable sample far more slowly, and the same century of data supports very different degrees of confidence in the two.
Can a four year cycle be traded at retail holding periods?
Not in the form the theory states it. Expressing a view built on years of data means holding exposure for a large part of a term, carrying the financing and every drawdown inside that span. An account that closes positions within days has no mechanism for that view, and shrinking the idea to fit a short horizon discards the only thing the sorting exercise ever claimed to show.
Risk notice. This page is educational. It examines what a published market theory claims and what body of data stands behind it. Nothing here is a recommendation to buy or sell any instrument, no move in any market is forecast for any year of any political term, and no expected result is stated or implied. Leveraged trading carries a high risk of loss.