
TD Sequential Indicator: What Actually Cancels a 13 Count

TD Sequential counts bars. Almost every explanation of it teaches the counting and stops there, which leaves a reader able to recognise a 13 and unable to say when that 13 has stopped meaning anything.
The company that created the indicator publishes two conditions that do exactly that job, one about price and one about time. Neither appears in the two comparable explanations read for this page. One of those explanations also states the counting rule itself differently from the originator, in a way that changes which bar the 13 lands on.
What follows sets out the two phases as their author defines them, shows where the published accounts diverge from that definition, and covers what a completed count does and does not claim.
Key takeaways
- The indicator runs in two phases. A Setup of nine bars must complete before a Countdown of thirteen can begin, and the two phases test different things.
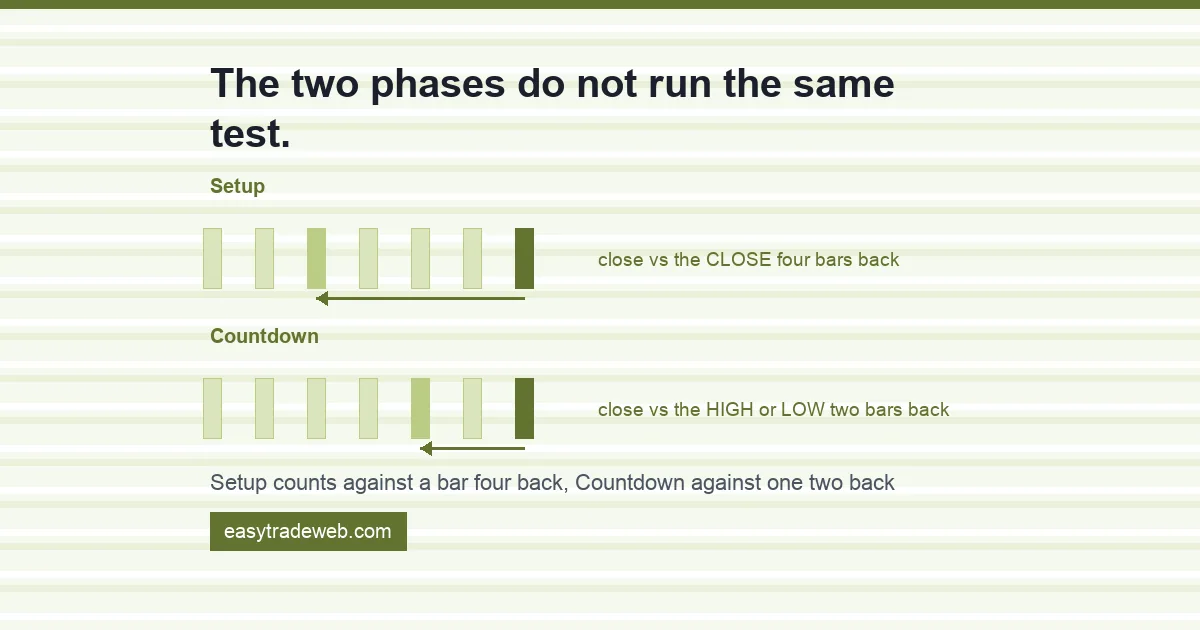
- The Setup compares each close with the close four bars earlier. The Countdown, in the documentation of its originator, compares each close with the high or the low two bars earlier, not with the close.
- Both comparable explanations read for this page describe the Countdown as a close-against-close test. That produces a different set of qualifying bars, so two readers following the two descriptions will disagree about where the 13 sits.
- A completed 13 carries a price limit and a time limit. The Risk Level is the price beyond which the reading is no longer active, and the twelve bar metric is the window inside which the reversal is expected to appear.
- Neither comparable mentions either limit. A count taught without them has no point at which it can be declared wrong, which is a problem for any signal a reader intends to act on.
Table of contents
- What the Indicator Counts, in Two Phases
- The Setup Phase and the Bar Four Back
- Where Two Published Explanations Disagree With the Originator
- Perfected and Im-perfected, and Why the Distinction Exists
- The Two Conditions That Cancel a Completed 13
- Why a Countdown Can Finish in a Range and a Setup Cannot
- What the Count Does Not Tell You
- Questions Readers Ask About TD Sequential
What the Indicator Counts, in Two Phases
Sequential is described by DeMARK Analytics as a multi-phase comparison of price against its own recent history, built from a Setup component and a Countdown component. The stated purpose is not to follow a trend but to anticipate the point at which one is exhausted.
That ordering matters and is often lost. The Setup runs first and must complete before the Countdown starts. They are not one continuous count from 1 to 13, and they do not use the same test. A reader who treats the numbers on a chart as a single sequence has merged two separate measurements.
The framing behind both phases is stated plainly by the firm: a market tops not because sellers are clever but because the last buyer has bought, and bottoms not because buyers are clever but because the last seller has sold. The counting is an attempt to put a number on how far that process has gone.
Because every comparison looks backwards at bars that have already closed, the tool belongs with the counting and timing indicators rather than with anything predictive, and the distinction between a lagging count and a forecast holds here as it does elsewhere.
The Setup Phase and the Bar Four Back
A Buy Setup is nine consecutive closes, each one lower than the close four bars before it. A Sell Setup is the mirror: nine consecutive closes, each higher than the close four bars before it.
Two details in that sentence do the work. The comparison is against a bar four back, not against the previous bar, so a market can print a higher close and still advance a Buy Setup as long as it remains below the close four bars earlier. And the nine must be consecutive. One bar that fails the test ends the Setup and the count starts again from the beginning.
The reference to a bar four back is stated the same way by both comparables read for this page, so the Setup rule is not in dispute. It is the phase that follows where the accounts separate.
The count is a measure of persistence rather than of distance travelled, which is why it can complete without the market having moved far, and why a completed Setup is not by itself an overbought or oversold reading in the sense an oscillator produces one.
Where Two Published Explanations Disagree With the Originator
Once a Setup completes, the Countdown begins, and it runs to thirteen. Here is what DeMARK Analytics documents. A Countdown bar qualifies on where its close falls against the high, or the low, printed two bars before it. The reference is an extreme of that earlier bar, not its closing price.
Here is what the two comparable explanations say. Both put the reference at the closing price of the bar two back. One asks whether the later close finished higher than that earlier close; the other sets the same close-to-close test against the four-bar test of the Setup phase and treats the pair as the difference between the phases.
Both therefore describe a close-against-close test where the originator describes a close against a high or a low. These are not the same condition. In a Sell Countdown the documented test asks whether the close reached the high of the bar two back, a level at or above the close of that bar; a reader applying the close-to-close version will qualify bars the documented version rejects.
The consequence is practical rather than academic. Two people counting the same chart, one from each description, arrive at a 13 on different bars, and the later that divergence appears in a long count the further apart the two answers sit. Anyone comparing a hand count against a platform script and finding a mismatch should check which of these two rules the script implements before concluding that either is broken.
Perfected and Im-perfected, and Why the Distinction Exists
A completed Setup is classified in one of two ways. It is Perfected when the ninth bar has completed and the sixth and seventh bars have been exceeded. Where that has not happened, the Setup is Im-perfected. The point at which a Setup perfects is marked on the chart with an arrow.
The distinction exists because reaching nine is a statement about a sequence of closes, while perfection is a statement about how far the extreme of the move has travelled relative to bars inside that sequence. A count can satisfy the first and not the second.
Only one of the two comparables addresses this at all; the other does not use the term. A reader working from that second account has a two-state indicator where the design has four, counting Setup and Countdown separately, and would treat every completed nine as equivalent.
The same phase produces a further reference, the TD Setup Trend. It anchors a level at each extreme of the trends just past, one at the deepest true low and one at the highest true high.
Those levels then serve as support and resistance for judging whether a move is still intact. It is closer in spirit to a level than to a signal, and it is read against price in much the way divergence between price and an oscillator is read: as a condition attached to a move, not an instruction.
The Two Conditions That Cancel a Completed 13
This is the part absent from both comparables, measured rather than assumed: neither file contains the term Risk Level, and neither contains any reference to a twelve bar rule.
The Risk Level is generated when a Countdown series completes. It marks the residual trend momentum the reading can absorb and still stand.
Where it sits depends on the direction. After a Buy Countdown finishes, the buy reading survives only while the market holds above the level, and it behaves as support whenever price weakens toward it.
After a Sell Countdown, the mirror applies: the sell reading survives only while the market stays beneath the level, which then behaves as resistance on any push higher. Once price passes through it in either case, the firm treats the momentum as having overwhelmed the reading.
The second condition is time rather than price. The twelve bar metric puts a deadline on the reading: the turn is expected to arrive no more than twelve bars after the 13 prints. Where nothing has answered by that point, the documentation treats the reading as having lost its force, and continuation of the move already under way as the likelier outcome.
Together those two turn a count into something falsifiable. Without them a 13 can be pointed at indefinitely, and every eventual turn confirms it while every failure is treated as a delay.
With them there is a price at which the reading is void and a bar count after which it has expired, which is the difference between a signal and an observation. It is also what separates a count that has genuinely failed from a signal that fails immediately and is misread as never having been valid.
Why a Countdown Can Finish in a Range and a Setup Cannot
The Setup requires nine consecutive qualifying closes. The Countdown does not require its counts to be consecutive; qualifying bars are numbered as they occur and non-qualifying bars are simply passed over.
One consequence follows directly, and the originator states it: because the Countdown tolerates interruption, it can complete in a trading range as well as in a trend, while a Setup, needing an unbroken run, effectively cannot.
That asymmetry is worth holding onto because it changes what a 13 implies about the chart it sits on. A 13 does not certify that a strong directional move preceded it. It certifies that thirteen qualifying bars occurred after a Setup completed, however long that took and however choppy the intervening bars were.
| Setup phase | Countdown phase | |
|---|---|---|
| Length | 9 bars | 13 bars |
| Close is compared with | The close four bars earlier | The high or the low two bars earlier |
| Must the bars be consecutive | Yes, one failure restarts it | No, gaps are permitted |
| Can it complete in a range | Effectively no | Yes |
| What completion produces | A perfected or im-perfected 9 | A 13, a Risk Level and a 12 bar window |
What the Count Does Not Tell You
The indicator is a count of closes. It carries no volume input, no measure of how far price travelled, and no statement about what any particular market is likely to do next.
Every comparison in both phases is made against closing prices, which means the count depends entirely on where the bar boundaries fall. A daily chart on one platform and a daily chart on another can close at different times, and a count assembled from one set of daily closes is not guaranteed to match a count assembled from the other.
The published win rates and reliability claims circulating for this indicator do not appear in the documentation of the firm that created it, and no figure of that kind is stated on this page for that reason. Anyone wanting one has to produce it themselves, on the instrument and timeframe they actually trade, which is what testing on the instrument being traded is for.
Questions Readers Ask About TD Sequential
What does a completed 13 on TD Sequential mean?
It means thirteen qualifying bars have occurred after a nine bar Setup finished, and that the firm behind the indicator regards the market as prone to a reversal at that point. It is not a forecast and it is not open ended. The completed count arrives with a Risk Level, which is the price beyond which the reading stops being active, and a twelve bar window inside which the reversal is expected to appear.
Does the Countdown compare closes, or highs and lows?
In the documentation of DeMARK Analytics the reference is an extreme of the bar two back, its high or its low, and the current close is measured against that. Both comparable explanations read for this page put the reference at the closing price of that earlier bar instead. The two rules qualify different bars, so a count built on one will not always agree with a count built on the other.
What makes a setup perfected rather than im-perfected?
A Setup is perfected when the ninth bar has completed and the sixth and seventh bars have been exceeded. Where that has not happened the Setup is im-perfected. The point of perfection is marked on the chart with an arrow. Reaching nine and perfecting are separate events, and a Setup can reach nine without perfecting.
Can a Countdown finish without a trend?
Yes. The Countdown does not require its qualifying bars to be consecutive, so bars that fail the test are passed over rather than resetting the count. The originator states that this allows a Countdown to occur in trading range markets as well as trending ones. The Setup, which does require nine unbroken closes, effectively cannot complete that way.
How long does a completed 13 stay valid?
Twelve bars, by the twelve bar metric published alongside the indicator. Where nothing has answered inside that window, the documentation treats the reading as having lost its force and the move already under way as the likelier one to carry on. The Risk Level runs at the same time and can void the reading sooner, if price passes through it first.
Risk warning: this page is educational and describes how an indicator is defined and counted by the firm that created it. It is not advice to buy, sell or hold any instrument, and no indicator produces a profit because it is counted correctly. A completed count can be followed by continuation rather than reversal, and leveraged exposure to that outcome carries a high risk of loss.