
Calmar Ratio Explained: Return Measured Against Drawdown

A Calmar ratio is one division: annualised return on top, worst drawdown underneath. The arithmetic is the easiest part of it, and the only part most explanations spend their words on.
The two decisions that set the number are made before the division happens. One is how long a window the return is annualised over. The other is which drawdown figure goes underneath, and on a retail platform that is not a settled question at all.
Key takeaways
- The Calmar ratio divides annualised return by the largest drawdown over the same window. Both halves must cover the same stretch of time.
- Every published description applies a trailing thirty-six month window, and no issuer document defines that convention. A ratio computed over eight months is not a shorter Calmar ratio, it is a figure biased high in both halves.
- MetaTrader 5 prints six separate drawdown figures for one account, each with its own published formula. Which of the six sits in the denominator changes the ratio, and no comparable read for this page says which one belongs there.
- The MetaTrader 5 tester already reports Recovery Factor, which puts profit over the deepest fall the account took: the same shape without the annualisation and without the window.
- The word Calmar appears nowhere in that documentation, while Sharpe appears five times and has its own reported line.
Table of contents
- What the Calmar Ratio Divides
- The Thirty-Six Month Window, and What a Shorter Record Produces
- Which Maximum Drawdown Goes in the Denominator
- Your Platform Already Computes the Undated Version
- Calmar and MAR Are Not the Same Window
- Why No Source Defines a Good Value
- Where the Ratio Ranks Differently From Sharpe and Sortino
- Who This Page Is Not For
What the Calmar Ratio Divides
The numerator is a compound annual growth rate: the rate at which the account grew per year over the window, not the sum of the returns and not their average. The denominator is the largest peak-to-trough fall inside that same window, written as a positive number.
A strategy that compounded at eighteen percent a year while its worst fall from a high was twelve percent divides to 1.5: each unit of loss bought one and a half units of annual growth.
Two constraints sit inside that sentence and both are easy to drop. The numerator has to be annualised, so a window shorter than a year must be scaled up before it can be divided. And both halves have to cover the same stretch of time: a return taken from three years against a maximum drawdown taken from the whole life of the account is not a ratio of anything.
The Thirty-Six Month Window, and What a Shorter Record Produces
Every description read for this page applies a trailing window of thirty-six months, and none attributes it to an issuer, a standards body or a regulator. The convention is inherited rather than published.
That matters more than an unsourced number normally would, because the window is what makes the denominator meaningful. A maximum drawdown only falls. Given more months it can get deeper and never shallower, so a denominator measured over thirty-six months is settled in a way that one measured over eight months is not.
Run the ratio on eight months of a live account and two things happen at once. The return is annualised, multiplying those months up to a yearly rate as though the rest of the year would behave the same way. And the drawdown is whatever the worst fall has been so far, a number still waiting to be replaced.
The top half is inflated by extrapolation and the bottom half understated by not having happened yet. Both errors push the same way, so a short-window ratio is not merely less precise, it is biased high, and biased high exactly when a trader most wants reassurance from it. State the window beside the figure every time, and treat any Calmar ratio quoted without one as unreadable rather than as approximately right.
Which Maximum Drawdown Goes in the Denominator
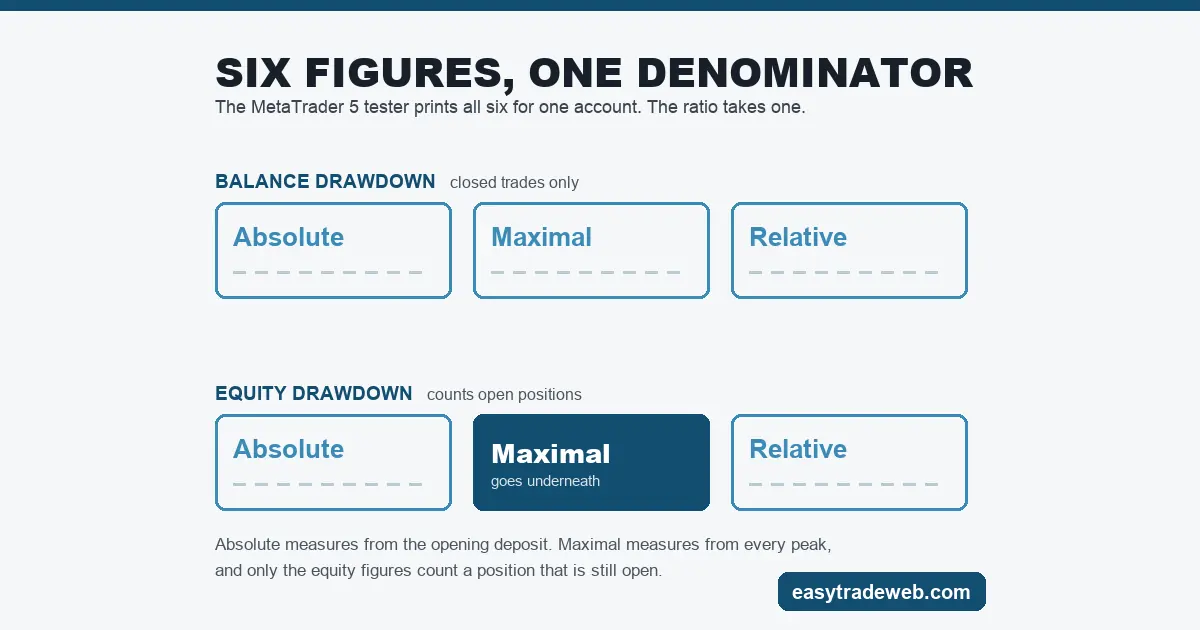
On a retail platform the phrase maximum drawdown does not resolve to one number. The MetaTrader 5 strategy tester report prints six of them for a single account, and the MetaQuotes documentation gives each a separate formula.
| Figure | Measured against | What it answers |
|---|---|---|
| Balance Drawdown Absolute | Initial deposit | How far below the starting sum the balance ever went |
| Balance Drawdown Maximal | Each local high | The largest fall in currency from any peak to the next trough |
| Balance Drawdown Relative | Each local high | The same fall expressed as a percentage of that peak |
| Equity Drawdown Absolute | Initial deposit | The same question asked of equity, so open positions count |
| Equity Drawdown Maximal | Each local equity high | The largest fall in currency including unrealised loss |
| Equity Drawdown Relative | Each local equity high | That fall as a percentage of the peak it fell from |
Three differences are consequential rather than cosmetic. Absolute is measured from the opening deposit, so an account that doubled and then halved reports a small absolute drawdown and a very large maximal one. Maximal is measured from each local high, so it keeps counting after the account is in profit. And the balance figures ignore open positions entirely.
An account holding an unclosed losing position shows a balance drawdown smaller than what the trader lived through, and an equity drawdown that reflects it. Choosing the balance figure therefore produces a higher ratio on exactly the style where the risk was highest.
None of the comparables read for this page names which of the six belongs underneath. The defensible answer is the maximal equity figure, the only one that counts every fall from every peak and counts open exposure while it is open. Two people using the same account and different rows of that table will not get the same number, so name the row.
Your Platform Already Computes the Undated Version
The MetaTrader 5 tester report carries a statistic called Recovery Factor. MetaQuotes defines it by dividing what a strategy earned by the deepest fall it sustained, which is the Calmar ratio with two things removed: the annualisation and the fixed window.
That cuts both ways. A trader who wants a Calmar ratio is not starting from nothing, and Recovery Factor should not be read as though it already were one.
A recovery factor of 3 says the run made three times its worst fall, over whatever period the run happened to cover. Without a time base it ranks six months and six years as equals. Annualising the profit while holding the same denominator converts one into the other, and that is the whole distance between them.
What is absent is worth as much as what is present: the word Calmar appears nowhere in that documentation, while Sharpe appears five times and has its own reported line. Sharpe is handed over ready-made and this ratio is not. The same gap shows up in trading expectancy, which the platform computes under a different name.
Calmar and MAR Are Not the Same Window
The two names are treated as interchangeable often enough to be worth separating. Both divide an annualised return by a maximum drawdown, and they differ in which stretch of history they look at.
The MAR figure is conventionally taken over the entire life of a track record, from inception to today. The Calmar figure is taken over a trailing window, the thirty-six months above. On a record older than three years the two answer different questions, and the gap widens with every extra year the Calmar window drops.
So a long-running record can show a strong Calmar ratio and a weak MAR ratio at once, with no contradiction, because a bad early period has left the Calmar window and not the MAR one. Neither figure is wrong. A comparison that mixes them is.
Why No Source Defines a Good Value
Bands are widely quoted for this ratio, most often that above one is acceptable and above two is strong. No issuer, regulator or standards body publishes those thresholds; they circulate because they are repeated.
There is a structural reason not to trust them beyond the missing source. The denominator is the worst thing that has happened yet, so the ratio rises through any quiet period without the strategy changing at all.
That makes it comparable between two strategies over one shared window, and close to meaningless as an absolute grade. Treat any threshold offered without a source as a convention rather than a finding, including the ones above.
Where the Ratio Ranks Differently From Sharpe and Sortino
The three measures share a numerator family and differ in what they put underneath. The Sharpe ratio divides by the standard deviation of returns, so it penalises a violent gain and a violent loss identically. The Sortino ratio divides by a dispersion figure built only from returns below a target. The Calmar ratio divides by a single worst outcome and ignores dispersion completely.
That last difference changes rankings. A strategy grinding out small losses without ever taking a severe one is punished by Sharpe and rewarded by Calmar. A strategy calm for years that then loses a third of the account looks acceptable on Sharpe and poor on Calmar.
Neither ranking is correct in the abstract. They answer whether returns arrived smoothly, and whether the account survived its worst moment. An account with a fixed loss limit is governed by the second, which is where this ratio earns its place.
Who This Page Is Not For
A trader with fewer than three years of records will not get a Calmar ratio out of this page and should not force one. The measurement needs a window it does not have, and the alternative is a number biased high in both halves.
Someone comparing two published figures from two providers is also in the wrong place unless both disclose their window and their drawdown definition, which most do not, and anyone looking for a threshold that certifies a strategy will not find one here.
Where the ratio works is on a return series that belongs to the reader, over a stated window, with one row of the drawdown table chosen and named. Under those three conditions it says what a volatility measure cannot: how much annual growth was bought with the worst loss the account actually took.
Frequently Asked Questions
What counts as a good Calmar ratio?
No issuer, regulator or standards body publishes a threshold. Values above one and above two circulate widely with no source behind them. The ratio also rises on its own through any quiet stretch, because the denominator is the worst event so far, so it ranks strategies over one shared window rather than grading them.
How does the Calmar ratio differ from the Sharpe ratio?
Both put a return figure on top. Underneath, the Sharpe ratio uses the standard deviation of returns, treating a large gain and a large loss as the same amount of risk. The Calmar ratio uses one number, the deepest peak to trough fall, and ignores how the rest were spread. The two can rank the same pair in opposite orders.
How is the Calmar ratio calculated?
Divide the compound annual growth rate of the account over the measurement window by the largest peak to trough drawdown recorded in that same window, written as a positive number. Both halves must cover the same period. On MetaTrader 5 the drawdown input has to be chosen from the six figures the tester prints, and that choice belongs beside the result.
Which period does a Calmar ratio need before it means anything?
Published descriptions use a trailing thirty-six month window, a convention no issuer document defines. A shorter record biases the figure upward twice over: the return is annualised from a fraction of a year, and the drawdown is a floor that has not finished falling. Quote the window alongside the ratio.
Risk warning: this page is educational and explains how a performance measure is constructed and where it fails. It is not advice to buy or sell any instrument, it recommends no product, platform or broker, and nothing here is a signal, a performance claim or a prediction. Past or simulated performance figures do not indicate future results, and leveraged trading carries a high risk of losing money.