
Sortino Ratio Explained: Why the Target Return Decides It

Two people can take the same twelve months of account returns, compute the Sortino ratio correctly, and end up with 0.58 and minus 0.09. Neither has made a mistake. They chose different target returns, and the target is not a detail of the calculation. It is the calculation.
That is the part most explanations leave out, and it is the part that decides whether the number in front of you means anything at all.
Key takeaways
- The Sortino ratio divides return above a chosen target by the dispersion of the returns that fell below that same target. Returns above the target contribute nothing to the denominator.
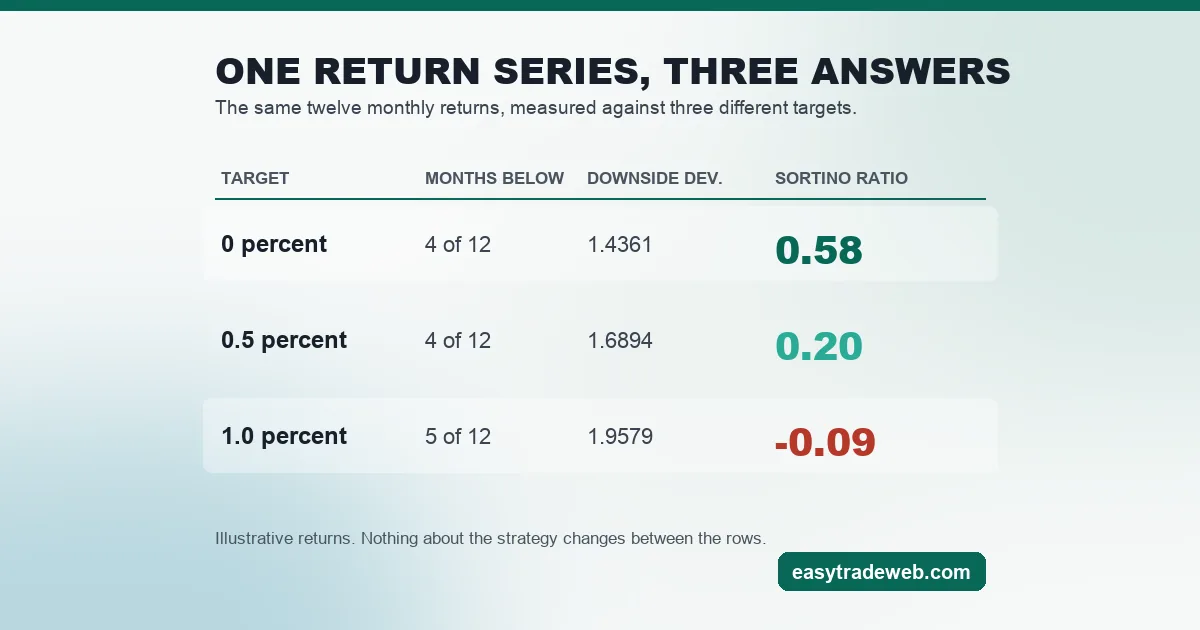
- The target return is an input you pick, not a property of the strategy. On the twelve illustrative months worked through below, targets of 0, 0.5 and 1.0 percent per month give 0.58, 0.20 and minus 0.09 from identical returns.
- A Sortino ratio quoted without its target return cannot be read, and cannot be compared with anyone else’s.
- MetaTrader 5 does not report a Sortino ratio. Neither the strategy tester report nor the MQL5 statistics list that a program can read contains one, and the string does not appear in either document.
- The Sharpe ratio the MetaTrader 5 tester does report uses a zero benchmark, so a Sortino ratio computed at a target of zero is the one that can be read beside it.
Table of contents
- What the Sortino Ratio Divides, and What It Refuses to Count
- The Target Return Is an Input, Not a Property of the Strategy
- Downside Deviation Is Not the Standard Deviation of the Losses
- Why MetaTrader Gives You Sharpe and Never Sortino
- Working the Number Through on One Set of Returns
- When Sortino and Sharpe Rank the Same Strategies Identically
- What a Sortino Ratio Cannot Tell You About an Account
- Who This Page Is Not For
What the Sortino Ratio Divides, and What It Refuses to Count
The Sortino ratio has the shape of every risk-adjusted return measure: something earned on top, something risked underneath. The top is the average return of the account over a chosen period minus a target return. The bottom is the target downside deviation, a dispersion figure built only from the periods that finished below that target.
The refusal is the interesting half. A month that returned nine percent when the target was one percent does not enter the denominator. Neither does a month that returned exactly one percent. Only shortfalls do, and the size of each shortfall is measured from the target, not from zero and not from the average.
This is the whole argument for using it. A measure built on the standard deviation of returns treats a violent gain and a violent loss as the same quantity of risk, because both are distance from the mean. An account that jumps eleven percent in one month is penalised for it. The Sharpe ratio works exactly that way, and the Sortino ratio was built to stop doing it.
What follows from that construction is a family of numbers rather than one number, and the rest of this page is about which member of the family you are holding.
The Target Return Is an Input, Not a Property of the Strategy
Every one of the top results for this term prints the formula with a symbol standing in for the target and then moves on to worked examples in which the target is quietly zero. Read as a set, they leave the impression that a strategy has a Sortino ratio the way it has a maximum drawdown.
It does not. The target enters the calculation in two separate places, and the second one is easy to miss.
First, it sits in the numerator, where raising it cuts directly into the excess return. That much is obvious from the formula. Second, and this is the part that changes the answer, it decides membership. Raising the target moves periods into the below-target set that were not in it before, and it lengthens the shortfall of every period already there.
So the denominator grows at the same time as the numerator shrinks. The two effects push the same way, which is why a modest change in the target can move the ratio a long way, and why it can push a positive figure below zero without a single return changing.
The practical consequence is short. A Sortino ratio quoted with no target attached is not a number you can use. If a platform, a signal seller or a fund factsheet prints one without saying what it was measured against, the honest reading is that you do not know what it says. Ask, or compute your own from the return series.
Downside Deviation Is Not the Standard Deviation of the Losses
The denominator has a name that invites a wrong guess. Target downside deviation sounds like it should be the standard deviation of the losing periods, calculated the way any spreadsheet would calculate a standard deviation over a filtered column. It is not, and the difference is not small.
Two things separate them. A standard deviation measures spread around the mean of whatever series it is given, so the losing months would be measured against their own average loss. Target downside deviation measures every shortfall against the target instead, which is a fixed reference chosen before the calculation starts.
The second difference is the divisor. The squared shortfalls are summed and then divided by the number of periods in the whole sample, not by the number of periods that fell short. Twelve monthly returns with four losing months are divided by twelve. That keeps the figure on the same footing as the average return sitting above it, which was also taken over twelve.
The size of that choice is worth seeing rather than describing. On the twelve returns used further down, dividing the same sum of squared shortfalls by the four losing months instead of by all twelve raises the denominator from 1.44 to 2.49 and drops the ratio from 0.58 to 0.34. Same returns, same target, different divisor.
Implementations do vary here, and the white paper usually cited as the primary source on the convention could not be reached while this page was written, so no rule is stated. The figures on this page use the whole-sample divisor throughout, and the sources line below names the document that was unavailable. It is a fair question to put to any tool that reports the ratio, alongside how it measures maximum drawdown.
Why MetaTrader Gives You Sharpe and Never Sortino
None of the five pages ranking above this one for the term names a trading platform at all. They are written for someone reading a fund factsheet. A retail trader reading a strategy tester report is in a different position, and the position is worth stating plainly.
MetaTrader 5 does not report a Sortino ratio. The testing report produced at the end of every backtest and optimisation run carries a Sharpe ratio, a profit factor, a recovery factor, an expected payoff and a linear regression correlation, and no Sortino figure at all.
The MQL5 statistics list, which is the set of values a program can read out of a completed test, tells the same story: a constant for the Sharpe ratio, none for Sortino. The word does not appear in either document.
That is not an oversight to complain about, it is a constraint to plan around. If the Sortino ratio is the measure you want, the tester will not hand it to you. You export the trade or balance series, aggregate it into periods, and compute the ratio yourself, which is a step to build into any backtesting routine rather than one to improvise afterwards.
One detail of the tester makes the comparison cleaner than it might have been. MetaQuotes documents a zero benchmark for the Sharpe figure the tester prints. A Sortino ratio computed at a target of zero therefore rests on the same benchmark, and the two can be read as a pair.
Choose any other target and they no longer answer the same question. Our page on the Sharpe ratio covers where that figure comes from inside a platform report; this page stops at the fact that its companion is absent.
Working the Number Through on One Set of Returns
Twelve monthly returns, illustrative rather than taken from any account: 3.0, minus 1.5, 2.0, 4.5, minus 2.5, 1.0, minus 0.5, 3.5, 2.5, minus 4.0, 1.5 and 0.5 percent. They sum to 10.0, so the average month is 0.8333 percent.
At a target of zero, four months fall short. Their shortfalls squared sum to 24.75, and dividing by twelve and taking the root gives a downside deviation of 1.4361 percent. The excess return is the full 0.8333, so the ratio is 0.58.
Raise the target to 0.5 percent and the same four months fall short, but each shortfall is half a point deeper. The squared sum rises to 34.25, the deviation to 1.6894, and the numerator falls to 0.3333. The ratio is 0.20, roughly a third of what it was.
Raise it again to 1.0 percent and the membership changes: the month that returned 0.5 percent is now a shortfall, making five. The squared sum reaches 46.00 and the deviation 1.9579, while the numerator turns negative at minus 0.1667. The ratio is minus 0.09.
| Monthly target return | Months below target | Downside deviation | Sortino ratio |
|---|---|---|---|
| 0 percent | 4 of 12 | 1.4361 | 0.58 |
| 0.5 percent | 4 of 12 | 1.6894 | 0.20 |
| 1.0 percent | 5 of 12 | 1.9579 | -0.09 |
Three numbers, one return series, and a sign change between the first row and the third. That is the point of the table, and it is why the target belongs beside the ratio wherever the ratio is printed.
When Sortino and Sharpe Rank the Same Strategies Identically
The Sortino ratio costs more effort than the Sharpe ratio, because the platform hands you one and not the other. It is worth asking when that effort buys anything.
The answer sits in the shape of the return distribution. The two measures differ only in what they put in the denominator, so they diverge only to the extent that dispersion above the target differs from dispersion below it. Where a return series is close to symmetric, the two denominators move together and the ordering of a set of strategies by one measure matches the ordering by the other. Ranking gains nothing from the second calculation.
Where the series is lopsided, the ordering can change. A strategy that grinds out small regular gains and takes occasional large losses looks different under a measure that counts only the losses, and so does its opposite, the strategy that loses small and often and wins rarely and large. Those are the cases the ratio was built for.
On the twelve returns above, the standard deviation is 2.4438 and the Sharpe ratio at a zero benchmark is 0.34 against a Sortino of 0.58. The gap is real but the direction is the same, which is what a near-symmetric series looks like. A third measure worth knowing about, the Treynor ratio, changes the denominator again and answers a different question entirely.
What a Sortino Ratio Cannot Tell You About an Account
The ratio compresses a return series into one figure, and several things a trader cares about do not survive the compression.
Order is the first. The ratio is computed from a set of period returns and takes no account of the sequence they arrived in. Four losing months scattered across a year and the same four arriving consecutively produce an identical Sortino ratio and a very different experience of the account.
Depth within a period is the second. A month that closed down two percent might have been down eleven percent midway through, and the monthly series carries no trace of that. Sortino says nothing about margin pressure or about how close an account came to a stop out. A measure built on the worst fall itself, such as the Calmar ratio, is the one that keeps that depth in view.
Duration is a fourth, and nothing in the construction reaches it: a target shortfall counts the same whether the account recovered the following month or stayed below its high for a year, which is the gap the ulcer index was built to fill.
Sample size is the third, and it is the one most often ignored. A ratio computed over six periods is an estimate with very little behind it, and the fewer periods that fall below the target, the thinner the denominator gets. With one losing month in a twelve-month sample, the denominator rests on a single observation.
Who This Page Is Not For
If the account has fewer than a couple of years of periodic returns, the ratio is not the measure to reach for first. Drawdown depth and duration describe a short record far better, and they need no target chosen and no assumption defended.
If the goal is comparing two published figures from two different providers, the ratio will not do that either unless both disclose their target return and their divisor, which most do not.
Where it earns its place is on a return series you own, at a target you have stated, alongside the drawdown figures rather than instead of them. Compute it at the target that reflects what the money would otherwise be doing, print that target beside the ratio, and treat any figure arriving without one as unreadable until somebody says what it was measured against.
Risk warning: this page is educational and explains how a performance statistic is constructed. It is not advice to buy or sell any instrument, it recommends no product, platform or broker, and nothing here is a signal, a performance claim or a prediction. Past or simulated performance figures do not indicate future results, and leveraged trading carries a high risk of losing money.