
The Weekly Crude Oil Inventory Report: Two Numbers, Not One

Two organisations publish a weekly figure for how much crude oil sits in United States storage. They publish a day apart, and most explanations of the release describe only one of them. The interval between the two prints is where a large part of the week’s oil volatility happens. This page sets out what the official report measures, who publishes the other number, why the two differ, and what the headline draw leaves unsaid.
Key takeaways
- The official release is the Weekly Petroleum Status Report, from the United States Energy Information Administration. Crude stocks are one line inside fourteen numbered tables covering refinery runs, imports, exports and prices.
- A second weekly inventory number exists. The American Petroleum Institute has published its Weekly Statistical Bulletin since 1929, on Tuesday afternoons at about 4:30 pm Eastern, by subscription only.
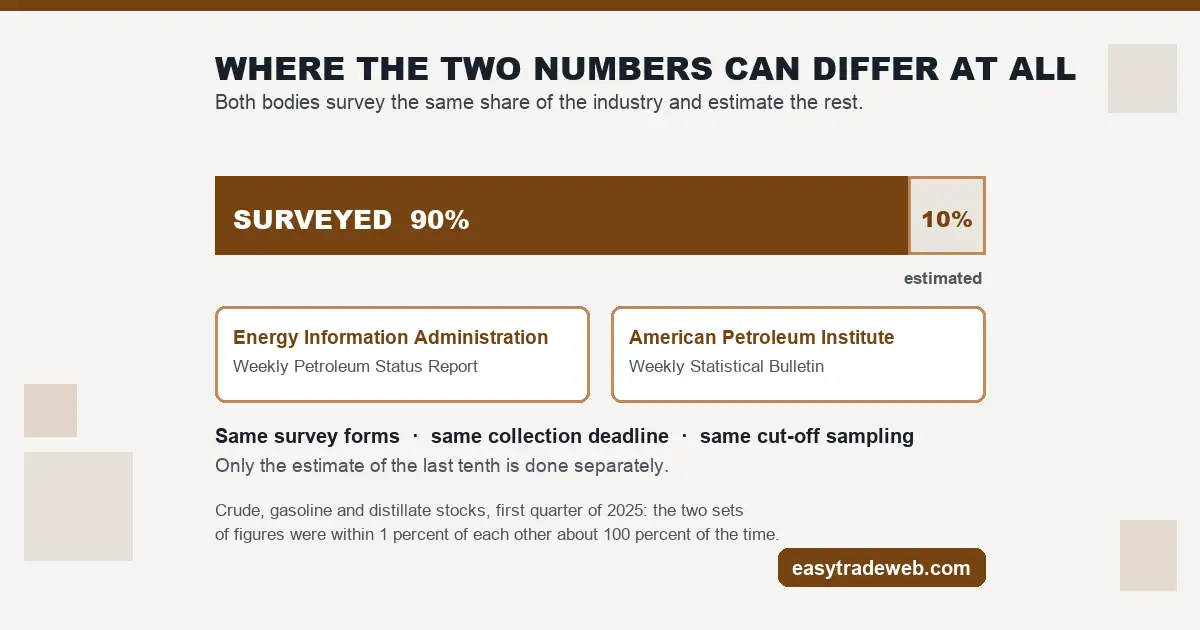
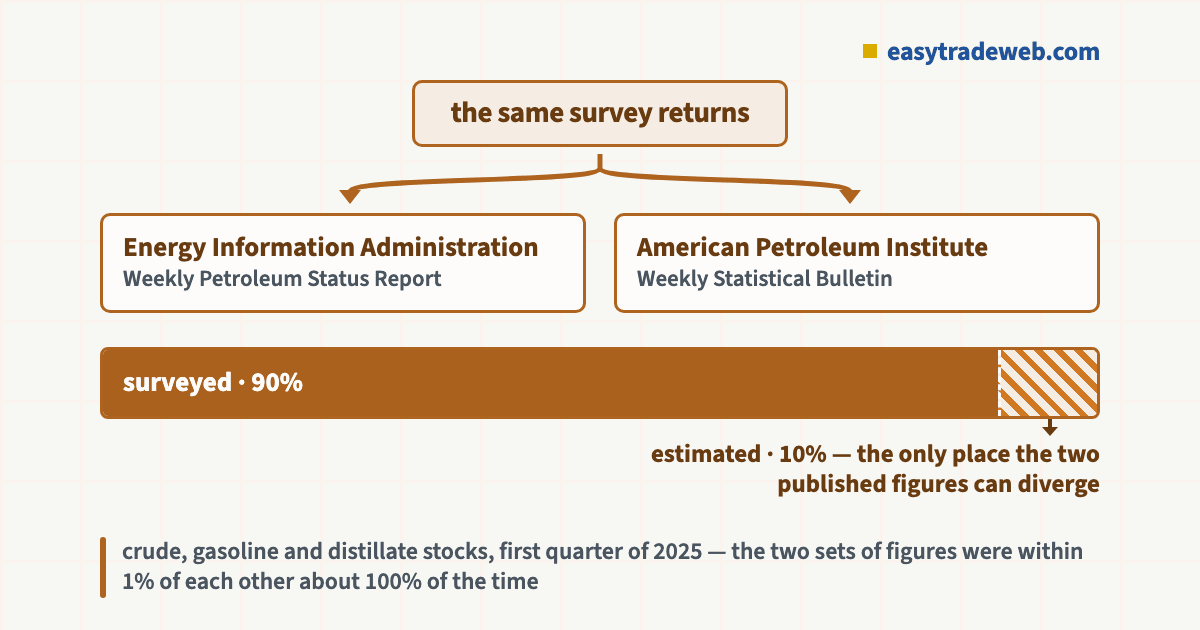
- The two numbers are not independent measurements. The Institute states that it takes a verbatim duplicate of the returns companies file with the agency, on the same survey forms, under the same collection schedule and deadline, using the same cut-off sampling procedure.
- Both bodies survey roughly 90 percent of the industry and estimate the remainder, and both publish only estimates each week. For crude, gasoline and distillate stocks in the first quarter of 2025, the Institute records the two sets of figures as within 1 percent of each other about 100 percent of the time.
- The agency report carries a published errata sheet and a statistical-methodology appendix for estimated petroleum exports. The headline draw is a modelled figure, not a count.
Table of contents
- What the Report Actually Counts, and Where the Barrels Sit
- Two Weekly Numbers From Two Different Bodies
- Why the Two Disagree, and What That Does to Price
- The Print Is an Estimate, and the Estimate Gets Adjusted
- What the Headline Draw Leaves Out
- Reading the Release Without a Forecast
- Which of the Two You Should Actually Watch
What the Report Actually Counts, and Where the Barrels Sit
The document traders shorten to the inventory report has a formal name and a formal publisher. It is the Weekly Petroleum Status Report, issued by the United States Energy Information Administration, and the agency states on the report page that it sets out the petroleum supply position for the week alongside historical series and a selection of prices.
Crude stocks are one line in it. The report is built from fourteen numbered tables plus a supplementary table 5A. Table 1 is a United States petroleum balance sheet. Table 2 covers refinery inputs and production. Table 3 covers refiner and blender net production, and tables 5, 5A and 6 cover gasoline, ethanol, distillate, jet fuel, residual fuel and propane stocks.
The crude figure most quoted comes from table 4, whose full title is stocks of crude oil by PAD district, and stocks of petroleum products, United States totals. That title carries the second thing worth knowing: the crude number is not one national pile. It is reported by Petroleum Administration for Defense District, so a national draw can conceal a regional build and the reverse.
Three further tables matter to anyone reading the headline properly. Table 7 covers imports and exports of crude oil and products, table 8 covers preliminary crude imports by country of origin, and table 9 is titled United States and PAD district weekly estimates.
Tables 11, 12 and 14 carry spot and retail prices, so the same document that reports the stock change also reports the prices for the two crude benchmarks it is read against, a distinction covered on our page on the two crude benchmarks.
Two Weekly Numbers From Two Different Bodies
The second number is the Weekly Statistical Bulletin, published by the American Petroleum Institute. The Institute states that it has reported total United States and regional crude inventories, along with data on refinery operations, since 1929.
Its coverage extends past crude to the production, imports and inventories of four refined products: distillate fuel oil, motor gasoline, residual fuel oil and kerosene jet fuel. Taken with crude, the Institute puts those five categories above 90 percent of everything United States refineries produce.
Two practical differences separate it from the agency report. The first is timing. The bulletin goes out on Tuesday afternoons, at about 4:30 pm Eastern, and shifts to Wednesday afternoon when the Monday is a federal holiday. The agency report is released on Wednesday, after 10:30 am Eastern.
Counting forward from 4:30 pm Tuesday to 10:30 am Wednesday gives an interval of 18 hours in which the Institute figure is the only weekly inventory number in circulation.
The second difference is access. The agency report is free on a public page. The bulletin is sold by subscription through two authorised redistributors, named by the Institute as LSEG and Intercontinental Exchange, which is why most retail traders meet the Tuesday number only as a headline repeated by a data vendor rather than as a table they can open.
Both land inside the same trading week, and the sessions they land in are set out on our page on when the oil market is actually open.
| Question | Weekly Petroleum Status Report | Weekly Statistical Bulletin |
|---|---|---|
| Publisher | Energy Information Administration | American Petroleum Institute |
| Scheduled release | Wednesday, after 10:30 am Eastern | Tuesday, about 4:30 pm Eastern |
| Access | Free, on a public page | Subscription, through two named redistributors |
| Survey forms used | Its own weekly survey forms | The same agency forms, by the Institute’s account |
| Industry coverage surveyed | Roughly 90 percent | Roughly 90 percent |
| The remainder | Estimated | Estimated by trend, seasonal, cyclical and imputation methods |
| Regional breakdown | By PAD district, in tables 4 and 9 | Total and regional crude inventories |
Why the Two Disagree, and What That Does to Price
The usual framing is that two rival bodies measure the same thing by different methods and reach different answers. The published account of the two surveys does not support it, and the difference matters to how a Tuesday-to-Wednesday divergence should be read.
The Institute sets out its own collection method plainly. It takes a verbatim duplicate of what companies file with the agency, it works from the same agency weekly survey forms, it offers respondents the same way of reporting, and it keeps to the agency collection schedule and deadline. The sampling procedure for both weekly surveys is the cut-off method.
What is left is a narrow band in which the two can differ at all. Each body surveys roughly 90 percent of the industry and estimates the remaining tenth, and the Institute attributes the differences between the two published series largely to statistical noise arising from their sample coverage and estimation processes. Its stated response rate runs at about 90 percent, varying by product and location.
There is a figure attached to how far apart they actually land. For crude, gasoline and distillate stocks during the first quarter of 2025, the Institute records the two sets of numbers as within 1 percent of each other about 100 percent of the time.
The consequence for a trader is not the one the rival-bodies framing suggests. The Tuesday number is best understood as an early read on the same underlying survey rather than as an independent second opinion, so a Tuesday print that is later contradicted on Wednesday is more often the noise band showing itself than new information arriving.
The Print Is an Estimate, and the Estimate Gets Adjusted
The word estimate is not an outside characterisation of this data. It sits in the agency’s own table titles: table 9 is published as United States and PAD district weekly estimates. Both bodies are on record that their weekly figures cover roughly 90 percent of the industry and that what they publish each week is an estimate.
The report page carries the apparatus that goes with an estimated series. Appendix B is a set of explanatory notes covering stock ranges. Appendix D is a statistical methodology for estimating petroleum exports from United States Customs and Border Protection data, which means the export line in table 7 is modelled rather than counted.
Appendix E is an errata document, and the errata file is also linked separately in the methodology sidebar in both spreadsheet and document form.
A published errata sheet is the part most worth pausing on. It exists because figures already released have needed correcting, and it is maintained alongside the report rather than buried. The Institute points in the same direction from the other side, urging that its weekly numbers be checked against the definitive monthly figures in the agency Petroleum Supply Monthly.
None of that makes the weekly print unusable. It makes it a provisional reading of a survey with a documented correction history, in the same family as a scheduled release with a published revision history, and a position sized as though the number were exact is sized against something the publisher does not claim it to be.
What the Headline Draw Leaves Out
Three things about the release are visible on the report page and rarely make it into the headline.
The first is age. The issue read for this page carried data for the week ending Friday 14 August 2026 and a release date of Wednesday 19 August 2026, with the next release listed for Wednesday 26 August. The number that moves price on Wednesday morning describes a week that closed five days earlier.
The second is that the release is staggered by format. The agency publishes the tables in comma-separated and spreadsheet form after 10:30 am Eastern, and the document versions after 1:00 pm. The move happens against the machine-readable files in the morning, while the full report document most readers picture arrives two and a half hours later.
The third is that a crude draw is only half of a supply picture. Table 4 reports product stocks beside crude, and a fall in crude accompanied by a build in gasoline and distillate describes refinery runs converting one into the other rather than barrels leaving the country. What the stock level then does to the shape of the forward curve is a separate mechanism, covered on our page on what storage economics do to the curve.
Reading the Release Without a Forecast
Neither publisher issues a consensus expectation. The forecast a headline compares the print against comes from surveyed analysts at a data vendor, not from the agency or the Institute, which means the surprise a reader reacts to is a gap against a private number rather than against anything official.
A reading built on the published document instead starts with the tables. Table 4 gives crude by PAD district, so the first question is whether a national change is broad or concentrated in one region. Table 9 gives the weekly estimates in one place. Table 7 gives imports and exports, and an unusually heavy export week can produce a crude draw that reflects cargoes leaving rather than demand rising.
The refinery side belongs in the same reading. Tables 2 and 3 cover inputs and net production, so a draw arriving in the same week as a jump in refinery runs describes crude moving into the refining system rather than disappearing from the country.
Two timing details finish the process. The agency maintains a release schedule page, which is the only reliable way to know when a holiday has shifted either publication, and the Institute publishes its own schedule of releases for the year alongside the rule that a federal holiday on the Monday moves the bulletin to Wednesday afternoon.
Which of the Two You Should Actually Watch
For most readers the answer is settled by access rather than by preference. The agency report is free, primary, and published in full with its tables, appendices and errata attached, so it can be read rather than received. The bulletin reaches a retail trader as a repeated headline from a vendor, stripped of the tables that would let anyone check it.
If a subscription through one of the two named redistributors is genuinely available, the Tuesday bulletin buys 18 hours of notice. What it does not buy is a second measurement, because it rests on copies of the same survey returns collected on the same forms to the same deadline.
Neither number is a forecast, and neither publisher presents one. Both describe a week that has already closed, both are estimates of a survey covering about nine tenths of the industry, and the sensible use of either is to understand what changed in the supply picture rather than to predict what happens next.
Risk warning: this page is educational and explains what two weekly data releases measure and how they are produced. It is not advice to buy or sell any instrument, it recommends no product, platform or broker, and nothing here is a signal or a prediction. Leveraged trading carries a high risk of losing money.