
WTI vs Brent Crude Oil: What Separates the Two Benchmarks

Two prices are quoted for crude oil every day and they are almost never the same number. On 18 August 2026 the Energy Information Administration published Brent at 95.29 dollars a barrel and West Texas Intermediate at 86.48, a gap of 8.81 dollars on the same commodity.
Most explanations of that gap stop at the crude itself: one is lighter, one is sweeter, one comes from the North Sea and the other from Texas. That settles nothing a position depends on. The grade does not decide what happens when the contract expires, what one contract obliges you to take, or whether your account can reach either market directly.
Two comparison guides were read while preparing this page. Both describe the crude and name the spread. Neither compares how the two contracts terminate, only one gives a contract size and then only in passing, and neither mentions the instrument a retail reader actually holds.
Key takeaways
- The two benchmarks are separate crude streams priced at separate points: WTI at Cushing in Oklahoma, Brent against a North Sea hub.
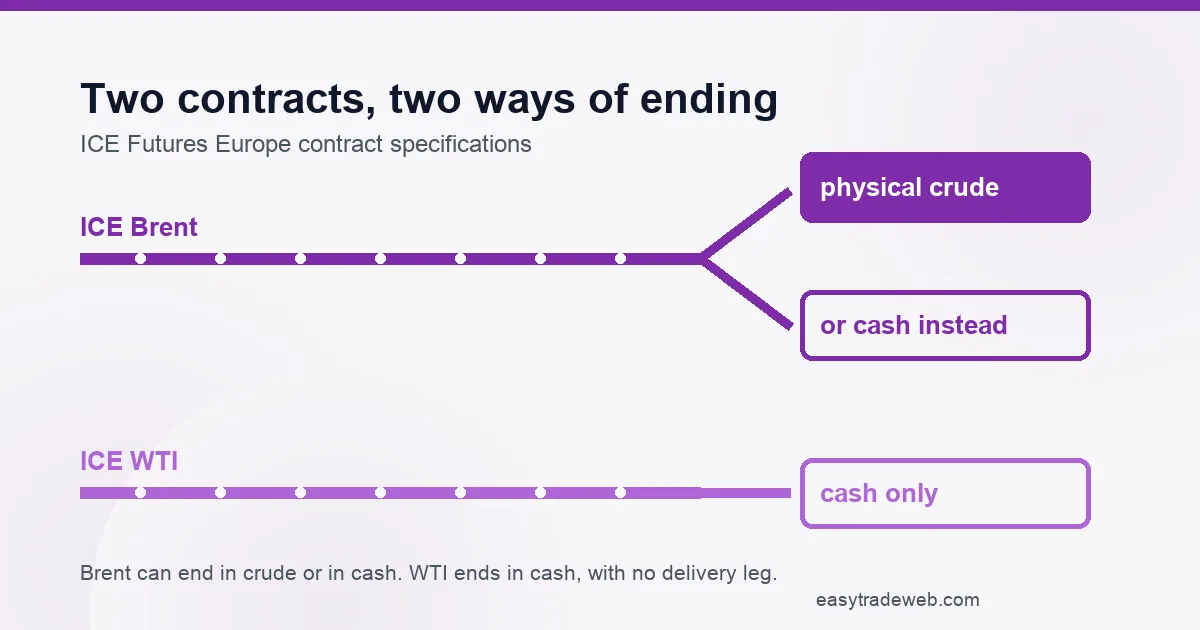
- The same benchmark exists as more than one contract and they do not terminate alike: ICE Brent can end in physical crude or in cash, while ICE WTI ends in cash only.
- Both ICE contracts are 1,000 barrels, and the minimum price move of one cent a barrel is worth 10 dollars on one contract.
- The spread is not a constant. Across the six sessions EIA published between 11 and 18 August 2026 it ranged from 6.39 to 9.26 dollars a barrel.
- Every figure here comes from ICE Futures Europe contract specifications or the Energy Information Administration, read on 22 August 2026. Exchange margin and the NYMEX contract specification are marked not disclosed.
Table of contents
- What the Two Benchmarks Physically Are
- Where Each One Is Priced and Delivered
- How Each Contract Terminates, and What That Means for a Held Position
- What One Contract Represents
- What Moves the Spread Between Them
- Which of the Two a Retail Account Can Actually Trade
- When the Choice Between Them Does Not Matter
- Frequently Asked Questions
What the Two Benchmarks Physically Are
A benchmark crude is a reference. The Energy Information Administration defines West Texas Intermediate as a crude oil stream coming out of Texas and the southern part of Oklahoma, used as the marker for pricing a range of other streams. Brent does the same job for North Sea production and for a large share of internationally traded cargoes.
Crude quality is measured on two properties, and the EIA glossary names both: sulfur content and API gravity. Together they decide processing complexity and what a refinery gets out of a barrel.
No official source reachable for this page publishes a single fixed sulfur or gravity figure for either benchmark. One of the two guides prints such a pair as though it were a constant and names no source for it; the other stays qualitative. Each benchmark is a stream, or in the Brent case a basket of streams, and the assay moves with what is flowing, so those numbers do not appear here.
That omission has a consequence: a trader who believes the benchmarks differ by a fixed quality margin will expect the price difference to be fixed too, and the rest of this page is about why it is not. Anyone starting further back may want the venues that list energy contracts.
Where Each One Is Priced and Delivered
This is the difference that does real work, and it is geography rather than chemistry.
The EIA publishes the WTI series under the heading Crude Oil WTI – Cushing, Oklahoma, and its glossary places the trading of that stream in the United States domestic spot market, at Cushing, a pipeline junction and tank farm several hundred miles from any coast. The Brent series is published as Brent – Europe, and the ICE Brent contract names its trading hub as the North Sea, where barrels sit at loading terminals with a ship alongside.
Inland against waterborne is the whole of it. A barrel at Cushing has to move by pipeline or rail to reach a refinery or a port, and that capacity is finite. A cargo loading in the North Sea is already on the water and goes wherever freight economics send it. The two prices therefore answer to different constraints: WTI to the United States pipeline and storage network, Brent to seaborne supply, freight and importing refiners.
The EIA WTI series runs from 1986 and the Brent series from 1987. The weekly, monthly and annual numbers the agency publishes are unweighted averages of daily closing spot prices, worth knowing before comparing a monthly average with a live quote.
The session in which each is traded is a separate matter and this page does not repeat it. It is set out on when the oil market is open, which covers the Brent and WTI hours side by side.
How Each Contract Terminates, and What That Means for a Held Position
Here is the distinction neither guide draws, and it decides what can happen to a position left open.
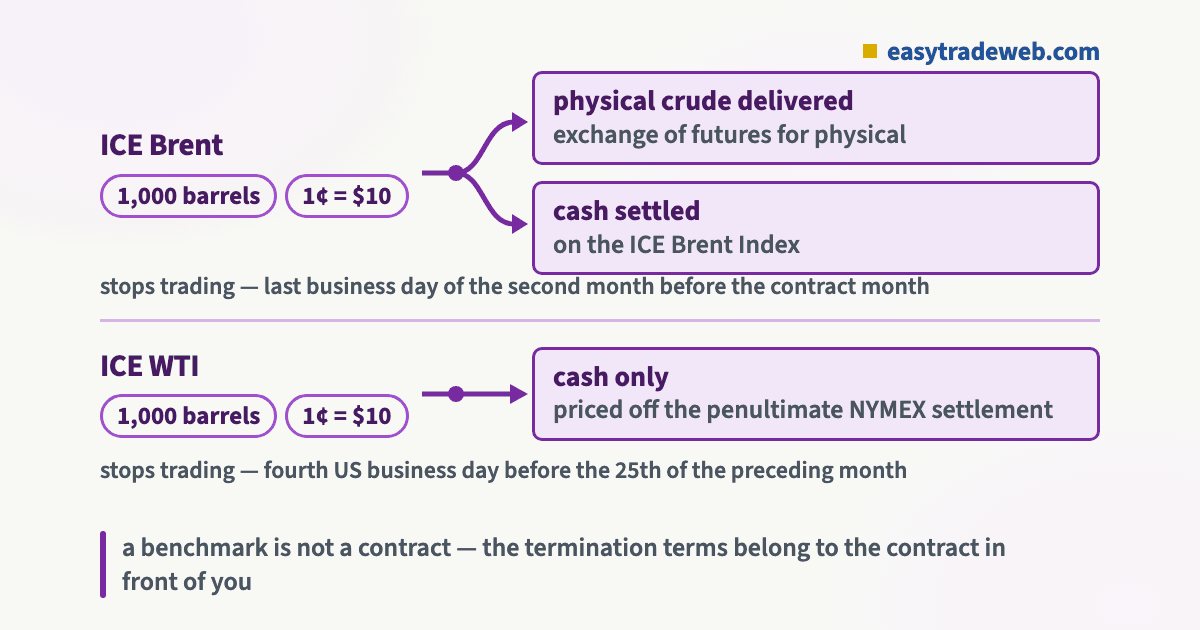
The exchange describes ICE Brent as deliverable. A position can end in physical crude through the exchange-of-futures-for-physical route, or the holder can take the cash alternative, valued on the ICE Brent Index figure struck for the final day of trading.
The ICE WTI Crude futures contract is not built that way. The exchange settles it in cash only, referenced to what United States light sweet crude is worth in the market, and priced off the second-to-last settlement figure NYMEX publishes for its own WTI futures in the production month. There is no delivery leg.
Read those two together and the popular framing collapses. It is commonly said that WTI is the physically delivered benchmark and Brent the financial one. On these two contracts it is the other way round, because a benchmark is not a contract. The termination terms belong to the contract in front of you, not to the name on it.
The expiry timing differs as well. ICE Brent stops trading two months ahead of the month it is named for, on that earlier month final business day, so the March contract ends in January. ICE WTI stops on the fourth United States business day before the twenty-fifth calendar day of the preceding month. Two contracts on one commodity, on unrelated schedules roughly a month apart.
The NYMEX WTI specification, the one usually described as physically delivered at Cushing, could not be verified: those exchange pages returned an access error on 22 August 2026, so nothing is claimed about it here. What happens to a position rolled rather than closed is covered under what the forward curve does to a held commodity position.
What One Contract Represents
One guide names a barrel count once, in passing, for a single contract. Neither uses it, and it is the number that turns a benchmark difference into something a reader can size.
Both ICE contracts are 1,000 barrels, traded in any multiple of that, quoted in United States dollars and cents, with a minimum price fluctuation of one cent per barrel. One cent across 1,000 barrels is 10 dollars, so a single tick is 10 dollars and a one dollar move in the benchmark is 1,000 dollars.
Applying that to a published price shows the commitment. At the 86.48 dollars EIA recorded for WTI on 18 August 2026, one contract stands against 86,480 dollars of crude; at the 95.29 dollars recorded for Brent, 95,290 dollars. Those are spot rather than futures prices, but the arithmetic is shown against numbers on an official page.
ICE lists Brent for up to 156 consecutive months and WTI for up to 108, so the Brent curve is quoted thirteen years out against nine. The Brent daily settlement is struck as the weighted average of trades in a two minute period from 19:28:00 London time.
Exchange margin is not stated here. It sits behind clearing pages that were not reachable on 22 August 2026, and an estimate would be worth less than the omission.
What Moves the Spread Between Them
Both guides name the spread and one recounts episodes from 2011 that widened it. Neither shows the difference as a series a reader can check, which is what turns it from an anecdote into a measurable quantity. Subtracting the EIA WTI series from the Brent series over the six sessions published between 11 and 18 August 2026 gives this.
| Date, 2026 | WTI – Cushing | Brent – Europe | Brent less WTI |
|---|---|---|---|
| 11 August | 84.77 | 93.26 | 8.49 |
| 12 August | 84.97 | 92.52 | 7.55 |
| 13 August | 82.77 | 92.03 | 9.26 |
| 14 August | 83.99 | 92.02 | 8.03 |
| 17 August | 86.04 | 92.43 | 6.39 |
| 18 August | 86.48 | 95.29 | 8.81 |
All prices are dollars per barrel from the EIA spot series released 19 August 2026; the final column is the subtraction. In six sessions the difference ran from 6.39 to 9.26 dollars, a range of 2.87 dollars. A trader treating the spread as a fixed premium has already lost the argument with the data.
Three mechanisms follow from the pricing points. The first is transport and storage on the United States network: barrels that cannot leave Cushing easily are worth less there, pushing WTI down against a waterborne grade.
The second is anything changing the cost or risk of moving seaborne cargoes, which reaches Brent first because Brent is a loading price. The third is regional supply, since United States production and inventories act on WTI directly while Brent answers to importing refiners. Those United States inventories are counted in the weekly inventory report, the scheduled release the WTI side of the spread reacts to.
The same asymmetry shows up in currencies that move with the oil price: which benchmark an exporter prices against is part of why those relationships differ.
Which of the Two a Retail Account Can Actually Trade
Neither guide mentions a contract for difference or a margin requirement, and this is the section their readers most need.
A 1,000 barrel exchange contract is not what most retail accounts hold. It stands against more than 85,000 dollars of crude at the prices above, and it terminates on the exchange schedule whether or not the holder is paying attention. The routes generally open to a retail account are a contract for difference referencing the benchmark, an exchange traded product, or a share in a producer.
A contract for difference on oil references the benchmark price without touching a barrel or an exchange contract, and the counterparty is the broker. It carries a financing charge for every night held, it is sized in whatever unit the broker chooses rather than in 1,000 barrel lots, and the broker decides which contract month the quote follows.
The termination behaviour described earlier belongs to the exchange contract; how a broker passes it through is set by that broker and published in its own terms.
Whichever route is used, size the position against the market it sits in rather than the account balance alone, the discipline set out for sizing an instrument against a thinner book. Broker spreads, financing rates and margins are not stated here: they differ by firm and by regulated entity, and the only correct source is the broker schedule.
When the Choice Between Them Does Not Matter
For many positions it does not matter which benchmark is chosen, and saying so is more useful than pretending otherwise.
The two prices move together far more than they move apart. Over the six sessions above both fell to mid month and both recovered into 18 August; what changed was the size of the gap, not the direction. A position held for a few days on a view about oil demand gets broadly the same result on either.
The choice starts to matter in three cases: when the position is held near an expiry, because the two contracts terminate on unrelated schedules and different terms; when the thesis is about United States pipeline, storage or production conditions, which act on WTI first; and when it is about seaborne supply, freight or import demand, which reaches Brent first. Outside those, the benchmark is a detail and the position is a view on oil.
Frequently Asked Questions
Why does Brent usually price above WTI?
Because they are priced at different places under different constraints. WTI is quoted inland at Cushing, Oklahoma, where barrels depend on pipeline and storage capacity to reach a refinery or a port. Brent is quoted against a North Sea hub, where cargoes are waterborne already. On the six sessions EIA published between 11 and 18 August 2026 Brent was above WTI on every one.
What does the WTI Brent spread actually measure?
The difference in dollars per barrel between the two published benchmark prices on the same day, and nothing more. It is not a fixed quality premium. Subtracting the two EIA spot series across six sessions in August 2026 gives a range of 6.39 to 9.26 dollars.
Which benchmark does a European trader normally follow?
Brent is the reference for barrels produced around the North Sea and the ICE Brent contract names the North Sea as its trading hub, which makes it the closer reference for European refining and import economics. What can actually be traded depends on the account and the instrument, and a broker may quote one, the other or both.
Does the grade difference matter for a short-term position?
Rarely. Grade decides refinery economics over weeks and months, not the direction of a benchmark over days. For a short position what matters is which pricing point the benchmark answers to, when the contract expires, and what the instrument costs overnight.
Risk warning: this page is educational and explains how the two crude oil benchmarks are defined, priced and contracted. It is not advice to buy or sell oil or any other instrument, it states no view on any future price, and nothing here is a signal or a prediction. Leveraged exposure to commodity markets carries a high risk of losing money.