
Dead Cat Bounce: What You Can Test While It Is Happening

A dead cat bounce is a rally that happens inside a fall and does not end it. The name is a market saying rather than a defined pattern, and the definition that circulates with it carries a condition that cannot be checked at the time: the rally only earns the name once price later goes below the low it bounced from.
Published descriptions concede the label is applied afterwards, then set out how to recognise one in progress. Nothing in them separates the part that can be measured now from the part that settles later.
What follows makes that separation, sets out where the two competing definitions disagree, and asks whether the idea survives the move from a share to a currency pair.
Key takeaways
- The term names a rally that fails, and the failure is the definition. Until price trades below the low that preceded the rally, no rally can be confirmed as one.
- Several conditions around it can be measured while the rally is running: the structure of the highs and lows, the length of the decline before it, and whether a dated event caused that decline.
- Two quantitative definitions are in circulation and they count different things. One measures the rally as a share of the fall it retraced, the other as a share risen from the low, and each assumes a different kind of decline beforehand.
- Every figure attached to the term on the pages read for this article was stated without a source, so none of them appears here.
- The equity version of the story relies on a single issuer and on exchange halts. A currency pair has neither, so part of the mechanism does not transfer.
Table of contents
What the Term Names, and What It Does Not
The phrase entered financial reporting in the mid-1980s as a piece of desk humour about a market that recovers a little after falling a long way. It has never been formalised. No exchange rule, regulator publication or standards body defines it, and the descriptions that carry it are commentary and teaching material rather than specifications.
What the term does name is a sequence of three events in a fixed order: a decline, a recovery that interrupts it, and a resumption that carries price beneath the low the recovery started from. The third event is the one doing the work. Remove it and the same first two events describe an ordinary interruption in a fall, or the beginning of a genuine turn.
So the term describes a completed sequence rather than a setup. The second event is identical to the second event of a genuine reversal until the third arrives, which every readable description concedes, usually in a sentence near the end.
The structural vocabulary for the sequence is older than the phrase and more precise. A downtrend is a run of lower highs with lower lows between them, and a rally that fails to take out the previous lower high leaves that run undisturbed.
Our page on how a trend is defined by successive highs and lows develops that framework in full. Stated that way the question stops being a matter of naming and becomes a matter of which levels have been passed.
What You Can Test While the Bounce Is Running
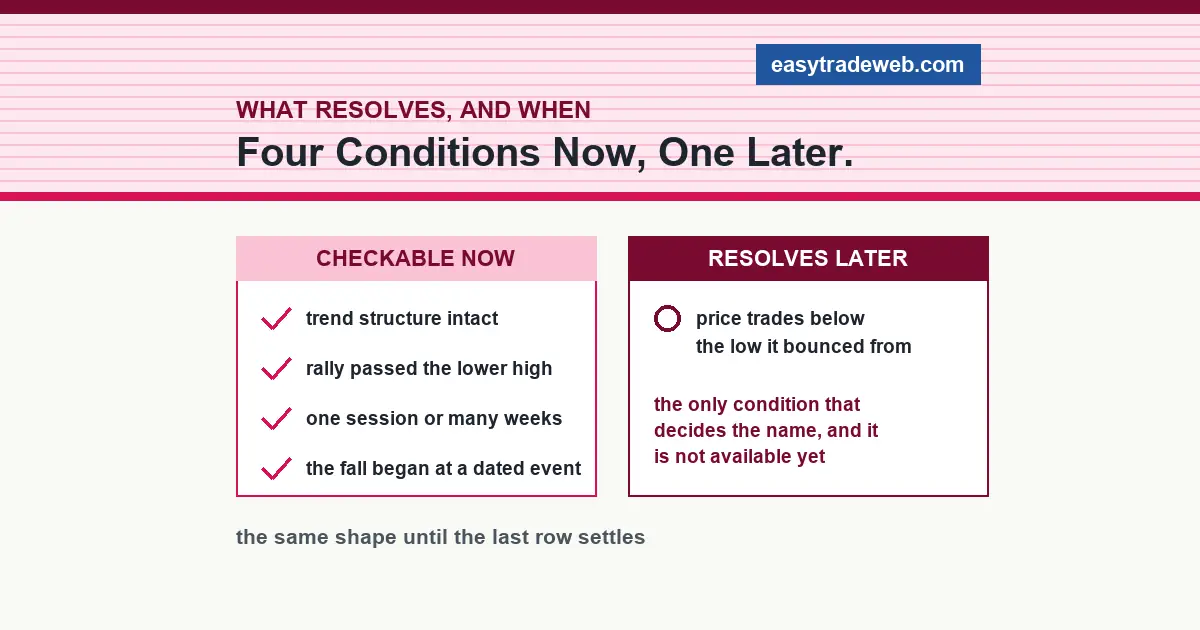
The useful split is not between a real bounce and a false one. It is between the conditions that can be checked on the chart in front of you and the single condition that cannot be checked until later.
Four things are observable while the rally is in progress. The first is trend structure: whether the sequence of lower highs and lower lows is intact, and where the nearest lower high sits. The second is the shape of the decline that preceded the rally, specifically whether it took one session or several weeks, because the two definitions in circulation assume different answers.
The third is whether that decline began at a scheduled, dated event, which is a matter of record rather than interpretation. The fourth is what the same move looks like on a slower chart, which is the subject of our page on reading the same move on two timeframes.
One thing is not observable: whether price will trade below the prior low. That is the condition the label rests on, and it resolves in the future or not at all.
The general question of how to trade an interruption inside a trend, rather than how to name one, belongs to our page on trading a pullback inside a trend, and this page does not repeat it.
| Condition | Checkable while the rally runs | What it settles |
|---|---|---|
| Sequence of lower highs and lower lows still intact | Yes | Whether the downtrend has been structurally disturbed yet |
| Rally has passed the nearest lower high | Yes | Whether the first structural condition for a turn is met |
| Decline before it ran one session or many weeks | Yes | Which of the two published definitions is even being applied |
| Decline began at a scheduled dated event | Yes | Whether a single identifiable cause is on the record |
| Participation behind the rally exceeds the decline | Partly, and not in spot foreign exchange | Nothing conclusive, because no consolidated tape exists in an over-the-counter market |
| Price trades below the low the rally started from | No | The label itself, and only afterwards |
Two Definitions, Two Different Denominators
Reading the descriptions side by side shows something that none of them mentions: they are not two accounts of one measurement. They are two measurements sharing a name.
The first treats the rally as a proportion of the decline it has retraced. The denominator is the size of the fall, the rally is expressed as a fraction recovered, and a ceiling is set above which the description no longer applies. The setup it assumes is a decline that developed over weeks.
The second treats the rally as a proportion of the low it started from. The denominator is the price at the bottom, the rally is expressed as a rise off that level, and it is paired with an average duration in days. The setup it assumes is different again: a single-session drop of unusual size, the kind produced by one piece of news.
A reader who takes a threshold from one and applies it to a chart matching the other is not making a rounding error. They are dividing by a different quantity, having already required a different precondition. The two answers can point opposite ways on the same chart, and neither description names the other or acknowledges that a second convention exists.
The structural reading avoids the problem, because it asks which levels have been passed rather than what percentage has been recovered. The first level that matters is the nearest lower high, the point our page on the first structural break in a trend is built around.
Does It Apply to a Currency Pair
Every description read for this page is written about shares or share indices. None says whether the idea transfers to foreign exchange, which for a currency trader is the only question that matters.
Two parts of the equity account do not transfer. The first is the issuer. A share belongs to a company that can miss an estimate, restate accounts or file for bankruptcy, and it has a floor at zero to fall toward. A currency pair is a relative price of two currencies: a fall in one is a rise in the other, and there is no issuer and no bankruptcy endpoint to price toward.
The second is the market machinery. On the United States equity exchanges a severe decline pauses trading outright. The New York Stock Exchange sets out three market-wide circuit breaker thresholds measured against the prior day closing price of the S and P 500 index, at 7 per cent, 13 per cent and 20 per cent, under NYSE, NYSE American and NYSE Arca Rule 7.12.
A halt produces something a chart cannot show as an ordinary bar: an interval in which no price prints, orders queue, and trading restarts from an auction. Part of the recovery being described is that restart.
Spot foreign exchange has no equivalent. The Bank for International Settlements measures it as an over-the-counter market rather than an exchange, and the FX Global Code, the reference document for conduct in that market, sets out principles of good practice rather than any halt mechanism.
There is no central tape, no coordinated pause and no reopening auction to produce the discontinuity. This page is about the spot market; exchange-traded currency futures sit under separate exchange rules and are not covered here.
What does transfer is the structural test, which needs neither an issuer nor an exchange: lower highs, a rally that fails to clear the nearest one, then a lower low. That is the same test underneath a setup like a setup built on failed breaks, approached from the other side.
Where the Circulating Numbers Come From
Five descriptions of the term were retrieved for this page and four could be read in full. Of those four, two state no figures at all. The other two state a set each, covering the size of the decline that qualifies, the size of the rally, how long it lasts and how often a second one follows.
Not one of those figures carries a citation. No dataset is named, no sample period is given, no exchange or index is identified, and no method is described beyond a general reference to past examples. Two numbers can look alike and be produced by counting different things over different periods, and there is no way to tell from the pages themselves.
Age is a second problem. One of the four was published in 2020, shows no revision date, and still uses the 2008 crisis as its only worked example. Another carries a maintenance notice about the reliability of its own references and cites nothing more recent than 2016.
The Numbers Left Off This Page
No percentage threshold for the qualifying decline appears here. No percentage range for the size of the rally appears here. No typical duration in days, and no frequency with which a second rally follows, appears here either.
Each of those exists in circulation and each was stated on a page read for this article without a source. A figure that no exchange, regulator or published dataset supports is not made reliable by appearing in several places, so the choice is to state where it came from or to leave it out. It is left out.
Where This Leaves You, and Who It Does Not Serve
This is not a page for anyone looking for an entry rule or a threshold to trade against. No such rule survives the fact that the defining condition sits in the future.
Which reading applies depends on what is in front of you. If the decline came in one session on a dated event and the instrument has an issuer, the second convention is the one being used around you, and the rally is being measured off the low.
If the decline built over weeks, the first convention is in play and the rally is being measured against the fall. If the instrument is a currency pair, neither convention brings its machinery with it, and only the structural test transfers: where the nearest lower high sits, and whether price has passed it.
Risk notice. This page is educational. It sets out how published descriptions of one market term differ from each other, and what each leaves unstated. Nothing here is a recommendation to buy or sell any instrument, no move described is a forecast, and no expected result is stated or implied. Leveraged trading carries a high risk of loss.