
Gold Silver Ratio: What a CFD Trader Is Actually Holding

The gold silver ratio is one number: the gold price divided by the silver price, read as the quantity of silver that one ounce of gold would buy. At 85 it takes 85 ounces of silver to match an ounce of gold.
Almost every page that explains it is written for someone who owns metal and is deciding whether to swap one for the other. That reader has a real question, and the ratio answers it. A reader on a margin account is asking something else entirely, and gets the same answer anyway.
What follows is what the number is computed from, why two screens show two values for it, what a position in it consists of on a leveraged account, and where the published averages and levels come from.
Key takeaways
- The ratio is a quotient, not a listed instrument. No exchange sets it, so its value depends on which two prices were divided, and at what moment.
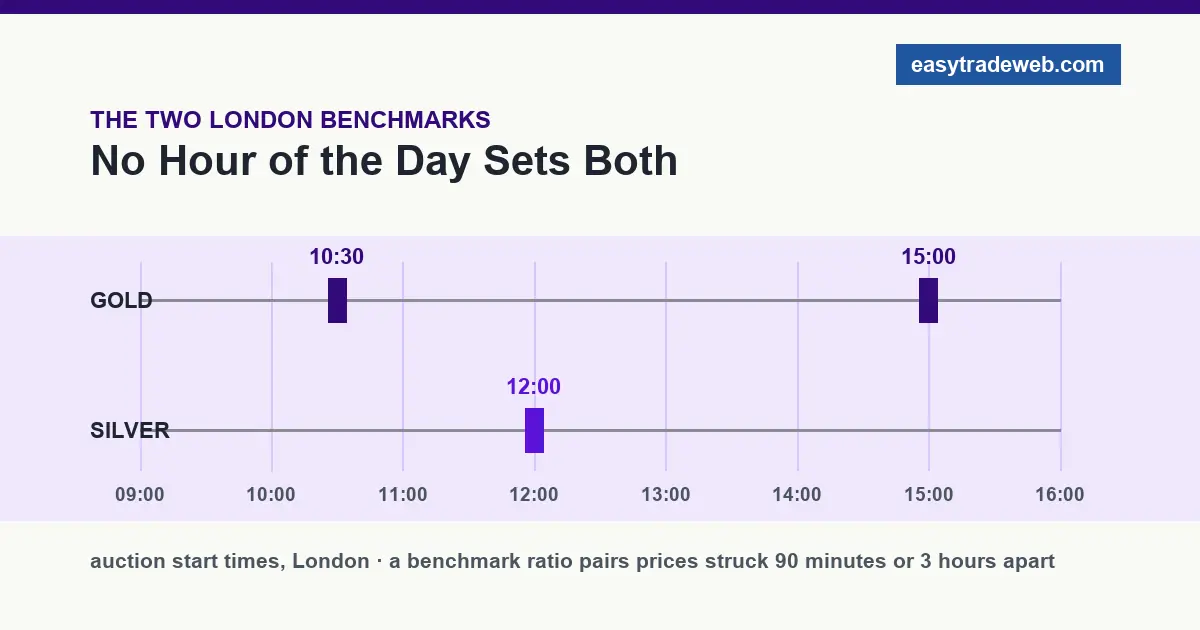
- The London benchmarks cannot produce a simultaneous reading at all: the LBMA Gold Price is set in two daily auctions, at 10:30 and again at 15:00 London time, and the LBMA Silver Price in a single auction at noon.
- Expressing the ratio on a CFD account is two positions in two symbols. They match in ounce terms, not in lots, and one lot of each is not a ratio position.
- The two legs are not margined alike. The retail leverage caps introduced by ESMA place gold at 20:1 and commodities other than gold at 10:1.
- Every long-run average in circulation is a different window, and any window reaching before August 1971 averages an administered gold price together with a market one.
- Industrial use took a record 680.5 million ounces of silver in 2024 out of total demand of 1.16 billion ounces, so the silver leg carries a demand cycle the gold leg does not.
Table of contents
- What the Ratio Measures
- Three Different Jobs for One Number
- Why Two Screens Show Two Different Ratios
- One Lot of Each Is Not a Ratio Position
- The Two Legs Are Not Margined Alike
- Every Average You Have Seen Depends on Its Window
- Where the 80 and 50 Levels Came From
- When the Ratio Stops Describing Anything
- Frequently Asked Questions
- Which of the Three Applies to You
What the Ratio Measures
Divide the price of an ounce of gold by the price of an ounce of silver and the currency cancels. What is left is a pure quantity of silver per unit of gold, which is why the same figure appears whether the two prices are quoted in dollars, euros or pounds.
That also fixes what the ratio cannot say. It carries no information about the level of either metal. Both can rise together while the ratio falls, and both can fall together while it rises; all it reports is which of the two moved further. A reader who wants to know whether gold has held its purchasing power is asking a separate question, and the case for gold as an inflation hedge is argued on entirely different evidence.
Three Different Jobs for One Number
The same figure is used by three readers whose situations have almost nothing in common, and the confusion in most published explanations comes from treating them as one.
The first owns metal. For that reader the ratio is an exchange rate between two things already held, nothing is financed, and the result is measured in ounces accumulated. Bars sitting in a vault cost only storage.
The second holds nothing. The ratio is one relative-price series among others, informing an opinion rather than a position, so nothing about margin or financing applies.
The third holds two contracts for difference. There are no ounces at the end of it, both legs are financed daily, both consume margin, and the position closes at a price rather than in metal. Everything specific to this reader is in the four sections that follow, and the general path into these markets is covered in the guide to starting in commodity trading.
The strategies published under this heading are almost all written for the first reader, and their logic depends on holding metal through the round trip. That is the one ingredient the third reader does not have.
| Reader | What is actually held | Cost of holding it | What ends the position |
|---|---|---|---|
| Owns metal | Bars or coins, in ounces | Storage, insurance, dealer spread on each swap | A swap into the other metal, decided by the holder |
| Reads the series | Nothing | None | Nothing to end |
| Holds two CFDs | Two contracts sized in ounces of two different symbols | Two spreads, two daily financing lines, margin on both legs | A closing price, or a margin close-out that reads the whole account |
Why Two Screens Show Two Different Ratios
No exchange lists the gold silver ratio. Every published value is computed by whoever published it, from two prices they chose, which is why quoted values differ by more than rounding.
The inputs are not equivalent. A site may divide two spot mid prices, two bid prices, prices derived from the front futures month, or the two London benchmarks. Each pairing gives a defensible number and none of them is the number.
The benchmark route has a feature that is rarely mentioned and settles the point. The LBMA Gold Price is set twice a day in auctions administered by ICE Benchmark Administration, the first commencing at 10:30 London time and the second at 15:00. The LBMA Silver Price is set once, in an auction commencing at noon.
There is no hour at which both benchmarks are struck. A benchmark ratio therefore pairs prices fixed ninety minutes or three hours apart, with two gold prices to choose between.
Before comparing a platform figure against a published one, check which symbols your broker quotes and how each is priced, starting with the silver symbol in MT5. A difference of a point or two is usually two different inputs rather than an error.
One Lot of Each Is Not a Ratio Position
A ratio position is long one metal and short the other. For the position to track the ratio rather than the direction of metals in general, the two legs have to carry the same amount of money, and that is where lots mislead.
Gold and silver symbols are quoted per ounce but carry different ounce counts per lot, and the counts differ between brokers as well as between the two metals. The size that matters is the notional: ounces per lot, multiplied by lots, multiplied by the price per ounce. Read both figures from the contract specification of your own account and compute each leg separately, because a lot is a container and not a quantity.
Matching those two notionals is the whole of the sizing problem. If the gold leg carries more money than the silver leg, part of the position is a directional bet on gold in the clothes of a ratio trade, and it profits when both metals rise without the ratio moving at all.
The general mechanics of running any position as two legs, including how the arithmetic behaves when the quote currency differs, is set out for currencies in the page on synthetic currency pairs, and applies unchanged here.
The Two Legs Are Not Margined Alike
Matched notional does not mean matched margin, and for these two metals the difference is written into the rules rather than the broker price list.
The retail restrictions introduced by ESMA set leverage limits by underlying, from 30:1 down to 2:1. Gold sits in the 20:1 band alongside non-major currency pairs and major indices. Silver falls under commodities other than gold, at 10:1. The FCA confirmed equivalent limits for UK retail clients in PS19/18, within the same 30:1 to 2:1 range, together with a close-out when account funds reach 50 percent of the margin required by open positions.
So two legs of equal size ask for different amounts of margin, and the silver leg asks for more of it. Which caps apply is decided by the regulated entity an account sits with rather than by the platform, and an entity outside those regimes may set limits of its own.
The close-out rule matters more than the initial figure, because it reads the account rather than the position. A ratio trade whose legs are hedging each other can still be closed by a fall in account equity that neither leg would have triggered alone. The same account-level exposure is examined for currencies in the page on pairs trading in forex.
Every Average You Have Seen Depends on Its Window
Published long-run averages for the ratio disagree with one another, and the disagreement is not a data problem. Each figure is an average over a different span of years, and the series is not one series.
The break is dated. On 15 August 1971 the United States ended the convertibility of dollars into gold, closing a system under which the dollar price of gold had been fixed at 35 dollars an ounce. Before that date one half of the ratio was an administered number and the other was not; after it, both were set in markets. An average taken across the break blends the two regimes into a figure that describes neither.
This is the same discipline that applies to any statistic computed over a rolling span, where a coefficient without its window is not a number anyone can check, as set out in the page on currency correlation. When a page states an average for the ratio, the question to ask first is which years it covers.
Where the 80 and 50 Levels Came From
Two numbers appear on nearly every page about the ratio: a high level around 80 and a low one around 50, sometimes with a third at 65. They are presented as boundaries of normal behaviour.
Six current pages on the subject were read for this article. Every one of them states levels of this kind and not one names a source, a dataset or the span over which the level was derived. They are conventions that have been copied forward, and they are described here as conventions for that reason and not as entry or exit rules.
What replaces them is not another number but a stated basis. Choose a window lying entirely after 1971, name it, and compute the average and spread of the ratio over it from the price series your own platform quotes. A threshold whose origin cannot be traced is not information about the market.
When the Ratio Stops Describing Anything
The ratio treats its two metals as comparable stores of value. Silver is also an industrial input, and the size of that use decides how far the comparison holds.
The Silver Institute reports industrial demand at a record 680.5 million ounces in 2024, against total silver demand of 1.16 billion ounces in the same year. Industry therefore accounted for close to three fifths of the total. A change in electronics or solar manufacturing moves one leg of the ratio for reasons that have no counterpart on the gold side, and during such a move the ratio is reporting an industrial cycle rather than a monetary one. The same reading applied to platinum reaches that limit sooner, because industry leads its demand outright rather than sharing it.
Two further conditions weaken it. Contract-level costs accumulate on both legs while the ratio stands still, an effect examined in the page on what CFD traders pay to carry a commodity. And a ratio can sit at an unusual level for years, which is a statement about the two metals rather than a countdown.
Frequently Asked Questions
What does the gold silver ratio actually measure?
It measures how many ounces of silver one ounce of gold would buy at the two prices used to compute it. Because the currency cancels out of the division, the result is a quantity rather than a price, and it reports only which of the two metals has moved further. It carries no information about whether either metal is expensive or cheap on its own.
Is there a level that counts as high or low?
Levels near 80 and near 50 are quoted very widely, but of the six current pages read for this article, none named a source or a period for them. They are repeated conventions rather than measured boundaries. A level a reader can defend is one computed over a stated window of years from a stated price series, and it is a description of history rather than a rule for entering or exiting anything.
Why do two brokers show different ratio values?
Because no exchange publishes the ratio and each provider computes it from prices of its own choosing. Spot mid prices, bid prices, prices derived from futures and the London benchmarks all give different results. The London benchmarks cannot even be paired simultaneously, since the gold auctions commence at 10:30 and again at 15:00, London time, while the silver auction commences at noon.
How is the ratio expressed on a leveraged account?
As two separate positions, long one metal and short the other, in two different symbols. The two legs have to match in money terms rather than in lots, since the ounces per lot differ between the two symbols and between brokers. Both legs pay a spread, both are financed daily while they remain open, and both consume margin.
Do both legs require the same margin?
Not under the retail limits introduced by ESMA, which place gold in the 20:1 band and commodities other than gold at 10:1, so the silver leg of an equally sized position requires more margin than the gold leg. The limits that apply depend on the regulated entity the account is held with. The margin close-out that follows from those rules is assessed on the account as a whole rather than leg by leg.
Which of the Three Applies to You
Where metal is already held and the question is whether to swap some of it, the ratio answers directly and the sections on margin and financing do not apply. If nothing is held, it is one series among many and no execution question arises at all.
If the intended expression is two contracts for difference, three checks come before any level is considered: the ounces per lot on both symbols from your own contract specification, the leverage cap applying to each metal at your entity, and the financing charged on each leg overnight. Those three decide what the position costs to hold, and no threshold copied from a chart page can answer them.
Risk notice. This page is educational. It explains how a ratio is computed and what a position expressing it consists of. Nothing here is a recommendation to buy or sell any instrument, no level is presented as a signal, and no outcome is stated or implied for any strategy. Leveraged trading carries a high risk of loss.