
Market Facilitation Index: Reading BW MFI on a Forex Chart

The Market Facilitation Index takes the height of a price bar and divides it by that bar’s volume. The platform plots the result as a histogram beneath the chart, and it answers one narrow question: how much price movement did each unit of volume buy.
Almost every published account of the indicator is organised around four colour names – green, fade, fake and squat. Those four names carry the entire interpretation, and a reader who learns them arrives at MetaTrader expecting to find them on the indicator.
They are not there. MetaQuotes describes four combinations of index and volume in its own help pages, names exactly one of the four, and calls it something else.
This page sets out what the index divides, what the volume figure underneath it counts on a forex symbol, and why the reading itself is not a level you can compare with anything.
Key takeaways
- MetaQuotes documents the calculation as the bar high minus the bar low, divided by the bar’s volume, with a multiplier whose only job is to turn a difference in points into a whole number.
- The MetaTrader 4 and MetaTrader 5 help pages name only one of the four index-and-volume combinations, and the word they use for it is curtsying, not squat.
- On a forex symbol the volume in the denominator is a count of price changes in the bar, not an amount traded. MetaQuotes states this on its Volumes page.
- The documentation says outright that absolute values mean nothing and that only changes in the index carry information.
- Because the multiplier exists only to make the number readable, index values cannot be compared between symbols, timeframes or brokers.
- MetaTrader ships two different indicators abbreviated MFI, and they measure unrelated things.
Table of contents
- What the Index Divides by What
- The Four Colour Names Are Not in the Platform’s Own Documentation
- On a Forex Chart the Denominator Counts Ticks, Not Money
- Why the Absolute Number Tells You Nothing
- Reading the Four Combinations Without the Colour Vocabulary
- Two Indicators, One Acronym
- Where This Repeats What a Volume Histogram Already Shows
- When This Indicator Will Not Help You
- Frequently Asked Questions
What the Index Divides by What
MetaQuotes gives the construction in one line. Take the highest price reached in the bar, subtract the lowest price reached in the bar, and divide what is left by the bar’s volume.
The quantity on top is the bar’s range. The quantity underneath is whatever the platform is counting as volume for that symbol. So the index is range per unit of volume, and nothing else is folded into it – no averaging, no smoothing, no reference to the close, and no comparison with any earlier bar.
One extra term appears in the published formula, a multiplier the documentation calls RANGE. It performs no analytical work. A range measured in points divided by a volume count produces a very small decimal, and the multiplier scales that decimal up so the histogram plots as whole numbers instead of a row of zeros. It changes the size of the figure on screen and not the shape of anything.
MetaTrader files the indicator in the Bill Williams group, alongside the Williams Alligator and the Awesome Oscillator. It is the only one of them that needs volume.
The Four Colour Names Are Not in the Platform’s Own Documentation
Search for this indicator and the same four labels come back from nearly every source. A bar where both the index and volume rise is called green. Both falling is fade or fading. Index up with volume down is fake or faking. Index down with volume up is squat.
The four states themselves are real and they are documented. MetaQuotes sets out all four combinations of a rising or falling index against rising or falling volume, and describes what each one is taken to mean.
What the help pages never do is attach those colour words to them. Read the MetaTrader 4 page and the MetaTrader 5 page for this indicator and the words green, fade and fake do not appear as state names anywhere. Exactly one of the four is given a name, the case where the index falls while volume rises, and the name recorded there is curtsying.
The gap is practical rather than pedantic. A trader who learns the colour vocabulary elsewhere and then opens the indicator finds no legend to match it against, no parameter selecting between the four names, and one documented term that appeared in none of the accounts they read.
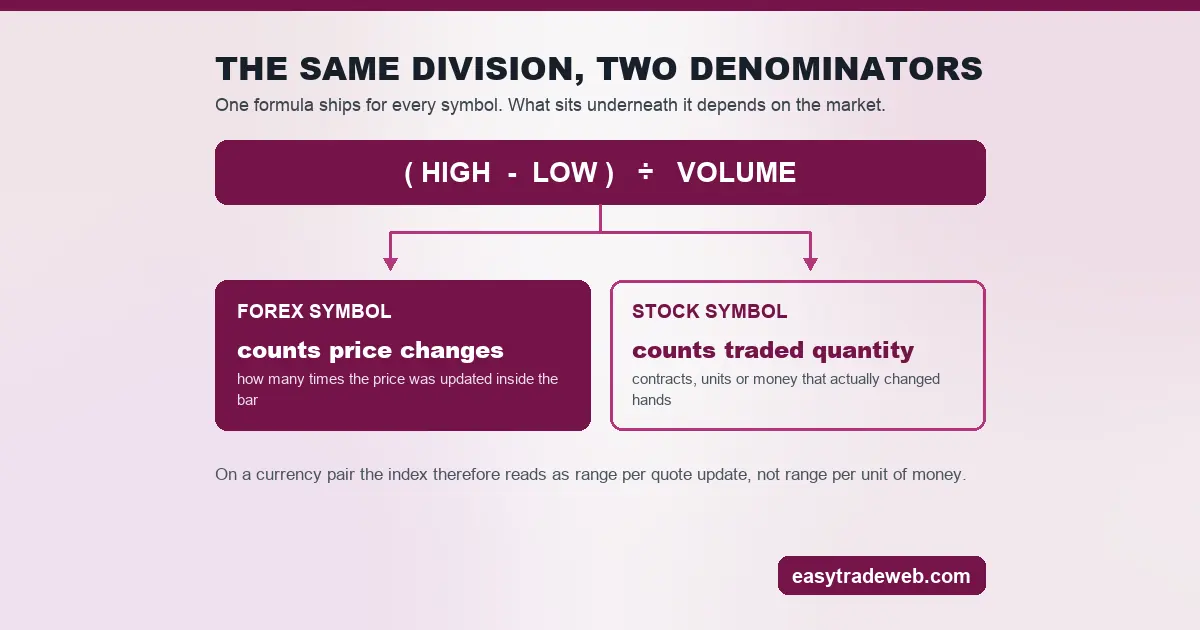
On a Forex Chart the Denominator Counts Ticks, Not Money
The formula divides by volume, and on a forex symbol that word does not mean what most readers assume it means.
MetaQuotes is explicit about it on the Volumes help page. For the forex market, the volume figure is the number of price changes recorded within the period. For stock symbols it is a quantity actually traded – contracts, units or money. Two different measurements, presented through the same indicator and the same histogram.
Follow that through the division and the reading changes character. On a currency pair the index is the bar’s range divided by how many times the price was updated during the bar. A bar where volume rose is a bar that ticked more often. It is not necessarily a bar where more money moved, because the feed never counted money in the first place.
The tick count also depends on who is sending it. A broker aggregating a handful of liquidity providers publishes a different number of updates for the same minute than one aggregating thirty, so the denominator is partly a property of the connection. The footprint chart exists because tick counts and traded size answer different questions.
None of this makes the indicator useless on forex. It does mean that the participant-based explanations attached to the four states are running on a proxy, and the proxy is a count of quote updates.

Why the Absolute Number Tells You Nothing
The documentation states this plainly, and it is the sentence most accounts leave out: absolute values of the index do not mean anything in themselves, and only changes in the index carry information.
The reason follows from the multiplier. Since a scaling factor was applied purely to make the figure legible, the size of the number reflects a display decision as much as it reflects the market. Two charts can show the same market condition at different index magnitudes.
So a level on this histogram is not a level in the sense that a bounded oscillator has levels. There is no overbought reading, no threshold that means anything across symbols, and no basis for calling one pair’s index reading stronger than another pair’s. The comparison that does work is this bar against the one before it, on this chart, which is exactly the comparison the four states are built from.
Reading the Four Combinations Without the Colour Vocabulary
Strip the colour names away and what remains is a two-by-two grid: the index rose or fell, and volume rose or fell. The documented reading of each is set out below in the terms the platform uses.
| Index | Volume | Documented reading | Named in the help pages |
|---|---|---|---|
| Rises | Rises | More participants are arriving and taking positions the way the bar is going, so the move is under way and gathering pace | No name given |
| Falls | Falls | Interest in this market has gone out of it | No name given |
| Rises | Falls | Client money is probably not behind the move, and the price is being pushed by dealing activity on the floor instead | No name given |
| Falls | Rises | Buyers and sellers are both active in size and neither is winning, so the range stays small; how the bar eventually breaks says whether the trend carries on or ends | Curtsying |
The fourth row is the only one the documentation names and the only one carrying an instruction: a small range on heavy activity is a stalemate, and the information sits in how the bar breaks afterwards rather than in the bar. The other three rows contain no signal and no direction, and the first of them describes a move already under way.
Two Indicators, One Acronym
MetaTrader 4 lists Market Facilitation Index and Money Flow Index in the same alphabetical index of technical indicators, a few entries apart. Both are shortened to MFI in ordinary use, and they have nothing in common beyond that.
Market Facilitation Index divides a bar’s range by its volume, read one bar at a time against the bar before it. Money Flow Index is built like the Relative Strength Index with volume added, and MetaQuotes documents its signal levels as readings above 80 and below 20.
So a question about whether MFI is overbought is a question about the second one. The first has no scale on which overbought could be defined.
Search results and forum answers move between the two without saying so, which is worth knowing before acting on any rule quoted for MFI.
Where This Repeats What a Volume Histogram Already Shows
A plain volume histogram already tells you whether this bar ticked more than the last one, and MetaQuotes colours those bars on exactly that comparison. Half of this indicator’s input is therefore visible on a chart that carries volume at all.
What the index adds is the pairing with range. If your chart already shows volume and you can read bar heights, you are one step from the same four states, and running both is one instrument rather than two.
When This Indicator Will Not Help You
A trader on a symbol with a thin volume feed is dividing by a number that describes the connection more than the market.
Anyone looking for an entry rule will not find one here. The documentation describes four conditions and names one of them, and it stops there rather than telling you what to do about any of them.
Frequently Asked Questions
How is the Market Facilitation Index calculated?
The low of the bar is subtracted from its high, and the result is divided by the volume of that bar. A multiplier is then applied so the figure plots as a whole number rather than a small decimal.
What does MetaTrader call a squat bar?
Curtsying. The MetaTrader 4 and MetaTrader 5 help pages describe the bar where the index falls while volume rises, and that is the term they record for it. The word squat does not appear in either page.
Why do two MetaTrader indicators share the MFI acronym?
Because Market Facilitation Index and Money Flow Index both abbreviate to MFI and both ship in the platform. The first divides range by volume bar by bar; the second is built like the Relative Strength Index with volume added, and MetaQuotes documents its signal levels above 80 and below 20.
What does the volume figure mean on a forex MFI reading?
On a forex symbol it is the count of price changes inside the bar. MetaQuotes reserves actually traded quantities for stock symbols, so the forex denominator measures how often the price was updated.
Should the Market Facilitation Index be read on its own?
The documented readings all pair the index with the direction of volume, so the index alone is half the input. It also carries no threshold or scale, which leaves nothing to read from a single bar in isolation.
Risk warning: this page is educational and describes how an indicator is calculated, what its inputs count, and what its documentation states. It is not advice to trade any instrument or to act on any indicator reading. No success rate or performance claim is made for this indicator or for any method built on it, and leveraged trading carries a high risk of losing money rapidly.