
Technical Indicators Guide: Top 7

Technical indicators are one of the tools used in technical analysis, and some traders rely on them heavily when deciding whether to act. A separate family of chart-reading vocabulary makes claims about who is trading rather than about price alone, and smart money concepts examines what the underlying data can support.
The first part of this article covers technical analysis, how fundamental analysis differs for currencies, and where the usual comparison between the two goes wrong. The second part explains the most widely used indicators one by one. A companion overview is available in Technical Indicators for Simpler trading.
Key takeaways
- Technical analysis reads price and volume. Fundamental analysis in currencies reads the relative position of two economies and two policy paths.
- The equity valuation toolkit does not transfer. A currency has no earnings, no balance sheet and no shareholders, so measures such as price-to-earnings have no currency equivalent.
- There is no intrinsic value for a currency pair. A rate is the price of one currency in another, so every fundamental judgement is comparative rather than a valuation against true worth.
- The claim that technical work is short term and fundamental work is longer term does not hold. The fastest moves of the day in currencies come from scheduled economic releases.
- The two methods answer different questions. Fundamental work suggests why a currency should be repriced; technical work marks where and when.
Table of contents
- What Is Technical Analysis?
- Advantages of Technical Analysis
- What Fundamental Analysis Means for a Currency
- Why the Equity Toolkit Does Not Transfer to FX
- Intrinsic Value Has No Currency Equivalent
- The Time-Horizon Claim, and Why It Does Not Hold
- Two Methods, Two Different Questions
- Combining Them Without Double-Counting
- Key Technical Indicators
What Is Technical Analysis?
Forex traders work with two main types of analysis, fundamental and technical. The sections below set out what each one measures and where the usual comparison between them goes wrong.
The core idea is that patterns of behaviour recur, so technical analysis studies past price movements to judge likely future price action. Such readings sometimes fail.
Advantages of Technical Analysis
Technical analysis cannot predict the future. It is built on historical prices and the idea that patterns of behaviour recur.
Its advantages:
- It can be done very quickly, just by identifying the strength of a trend
- It can be applied to any trading instrument and on any timeframe, from minutes to years
- It can be used alone or combined with fundamental analysis
- It shows a large volume of historical information on screen at once
What Fundamental Analysis Means for a Currency
Fundamental analysis in currencies studies the economic and policy position of one country against another. The usual inputs are growth, inflation, employment, the interest rate path set by each central bank, and surrounding political conditions.
Most of that information arrives on a published timetable rather than at random, as our guide to scheduled economic releases sets out, and weekly positioning data is a further fundamental input.
Why the Equity Toolkit Does Not Transfer to FX
Most published comparisons teach fundamental analysis using company measures: earnings per share, the price-to-earnings ratio, debt-to-equity and profit margins, illustrated with well-known equities.
None of it carries over to a currency pair. A currency does not report earnings, does not publish a balance sheet, has no shareholders and cannot be valued by discounting future cash flows, because there are none to discount.
The concepts that do survive the move are broader ones: supply and demand, the cost of holding one asset rather than another, and the effect of policy on that cost. An interest rate differential is the closest thing to a yield, and it is a property of the pair rather than of either currency.
Intrinsic Value Has No Currency Equivalent
Fundamental analysis is usually defined as estimating an intrinsic value and comparing it with the market price. That definition is borrowed from equities and does not survive the move to currencies.
There is no true worth for a currency to be measured against. Its price is expressed in another currency, which is itself moving, so the reference point moves with the thing being measured.
So fundamental work in currencies produces a direction and a rationale, not a target price with a discount to it. Statements of the form this currency is worth more than it trades at are missing the second currency the comparison requires.
The Time-Horizon Claim, and Why It Does Not Hold
A widely repeated claim, and one that appeared in an earlier version of this page, is that technical analysis suits shorter horizons while fundamental analysis works over longer ones. It is presented as settled and it is not supported.
The clearest counter-example is routine. Scheduled releases such as inflation and employment figures produce the sharpest intraday moves in the currency market, and those are fundamental events being traded in seconds.
What differs is the update frequency of the inputs. Price updates continuously, so technical inputs can be sampled at any interval; economic data updates on a schedule, so fundamental inputs change in steps. Neither fact sets a holding period.
Two Methods, Two Different Questions
Fundamental analysis addresses why a currency might be repriced. It supports a directional view and explains a move after the fact, but produces no entry level, stop or exit.
Technical analysis addresses where and when. It identifies levels, structure and timing, and it can be tested by backtesting a rule against history. What it does not supply is a reason.
Combining Them Without Double-Counting
A workable division lets fundamental work set the direction under consideration and the events to avoid holding through, and technical work set entry, stop and position size. Each input then has one job.
The failure to watch for is double-counting. Two inputs that are really the same view expressed twice do not confirm each other, and treating them as independent confirmation tends to produce larger positions rather than better ones.
Judging whether an indicator is adding information or repeating it is covered in our page on leading and lagging indicators, and the question of which chart answers which question in our guide to multi-timeframe analysis.
Key Technical Indicators
Each of the tools below is set out on its own page where the construction matters; the Awesome Oscillator is one where the calculation input decides how the reading behaves, and the Williams Alligator is one where a shift applied after the calculation decides where the reading is drawn, and the Chaikin Oscillator is one whose smoothing type is documented two different ways by the same vendor, and the Coppock Curve is one the platform does not ship at all, and the True Strength Index is one whose periods no vendor sets for you, and TD Sequential is one whose completed count carries a documented price limit and expiry that the popular explanations leave out.
Stochastic Indicator
This is a momentum indicator developed by George Lane. It helps traders identify overbought and oversold zones. Its fast line is also published under a second name, Williams %R, on a scale running from 0 down to -100.
Look at the chart below
Stochastic
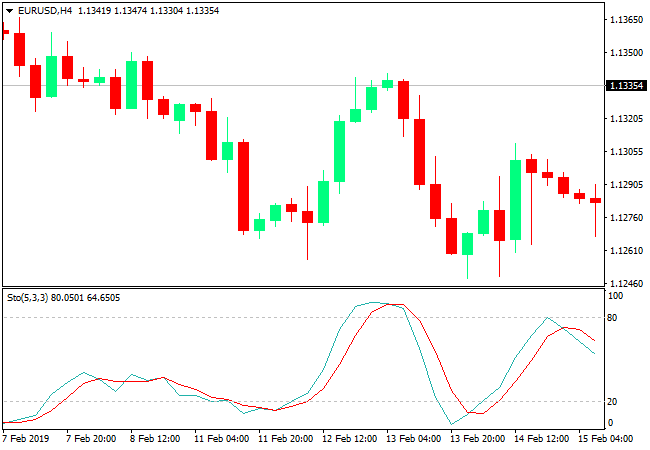
The chart above shows the Stochastic indicator on the MetaTrader platform. The indicator is made up of two moving averages (the blue line and the red line), one fast – %K – and one slow – %D. A widely used variant draws a third line from those two, and the three lines of KDJ sets out how it is built and why it leaves the 0 to 100 band.
When the reading is below level 20, this signals an oversold condition and a buy trade could be considered; conversely, when the reading is above level 80, this signals an overbought condition and a buy trade could be considered too. Remember that these signals alone shouldn’t be relied on to decide whether to execute a trade, so this is one of the technical indicators that should be taken into account.
Technical Indicators | Bollinger Bands
The Bollinger Bands indicator was developed by financial analyst John Bollinger. It’s used to identify trend direction by measuring volatility in the market, making it one of the technical indicators worth taking into account.
Look at the chart below
Bollinger Bands
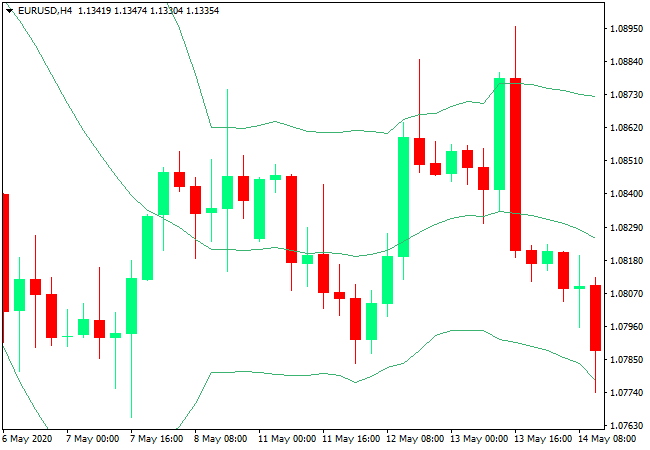
The Bollinger Bands indicator consists of three levels. When the price is close to the upper level, this indicates the market is in an uptrend; when the price is close to the lower level, this indicates the market is in a downtrend. If the price frequently touches the middle level, this indicates the market is trading in a range, or that there’s volatility in price movement.
Related: What Are Indices and How to Trade Them
Ichimoku Indicator
The Ichimoku indicator is a group of technical indicators that show support and resistance levels, as well as momentum and market direction.
Look at the chart below
Ichimoku
Ichimoku has several uses and is, on its own, a complete strategy. We’ll mention a few of them here.
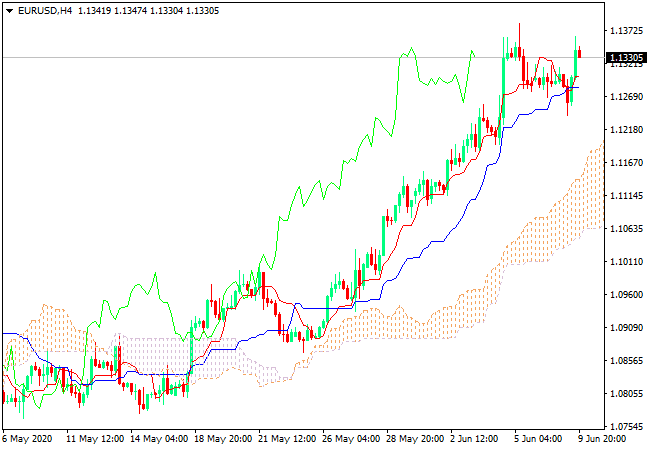
The cloud can be used to identify direction – when the price is above the cloud, this signals an uptrend, and when the price is below the cloud, this signals a downtrend. The cloud can also be treated as a support and resistance zone.

Technical Indicators | MACD
The MACD indicator is a momentum indicator that shows the relationship between two moving averages of a security’s price. MACD is calculated by subtracting the 26-period exponential moving average (EMA) from the 12-period moving average.
MACD
The MACD indicator consists of two lines – one called the signal line and the other the MACD line – plus a histogram. When the histogram value is positive (shown in green in the chart), this indicates an uptrend; when the histogram value is negative (shown in red), this indicates a downtrend. That makes MACD one of the technical indicators worth taking into account.
Related: The Most Widely Used Technical Indicators in Forex
Commodity Channel Index (CCI)
The CCI indicator measures the difference between the current price and its historical average price.
Commodity Channel Index
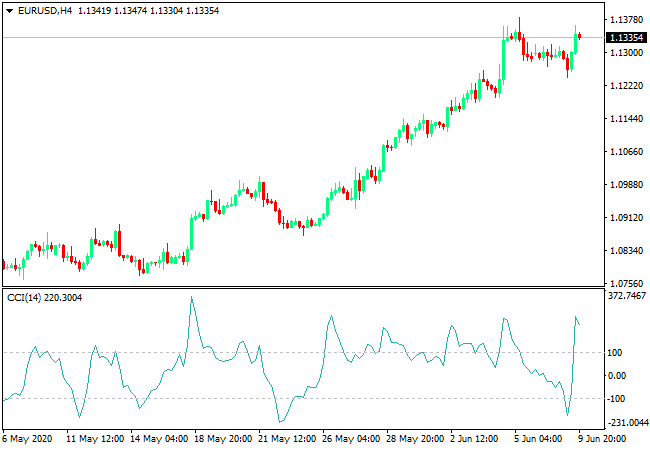
If the CCI is above zero, this means the price is above its historical average; when the CCI is below zero, this means it’s below the historical average.
In other words, if the indicator value is 100 or higher, this indicates the price is above the average of past prices, meaning the trend is up. Conversely, an indicator value below -100 indicates the price is below the average of past prices, meaning the price is trending down.
Technical Indicators | Relative Strength Index (RSI)
The Relative Strength Index (RSI) is also a momentum indicator. It consists of a single line scaled from 0 to 100 that identifies overbought and oversold market conditions.
If the indicator value is above 70, this signals an overbought market; if the reading is below 30, this signals an oversold market.
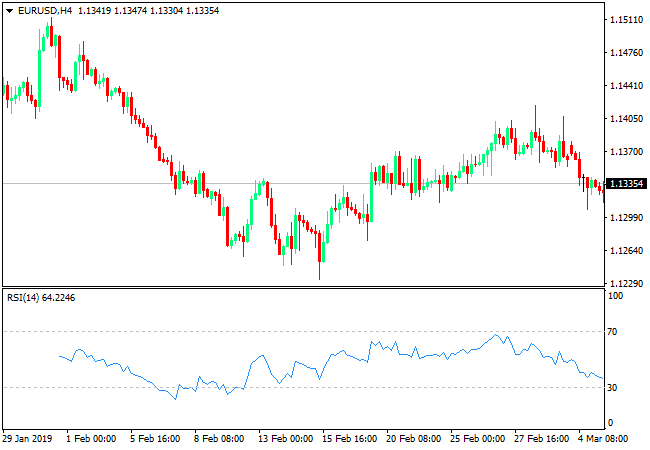
Relative Strength Index
We covered the RSI indicator in more detail in an earlier article you can read here.
Fibonacci Retracement
The Fibonacci retracement tool is one of the well-known Fibonacci tools, built on the Fibonacci sequence, where each level represents a value from the sequence.
Fibonacci numbers are also used in several fields beyond financial markets, such as nature, architecture, and biology.
One use of Fibonacci retracement is that it acts as support and resistance levels, so it can be used to anticipate where a correction might end.
We’ll keep this brief on Fibonacci levels, since we covered them in detail in an earlier article you can read here.
Technical Indicators: Key Takeaways
Test this indicator without risking capital
Reading about an indicator is not the same as watching it behave on a live chart. A demo account lets you apply the settings above to real market data and see how the signals form before any money is involved.
Advertising disclosure: partner link. Easy Trade may receive compensation. Educational content, not financial advice. CFDs carry a high risk of losing your capital.
Technical indicators are statistics used to measure current price conditions in the markets, as well as to forecast financial or economic trends.
In the trading world, technical indicators generally refer to technical chart patterns derived from price, volume, or open interest for a given security, and include popular indicators such as moving averages, Moving Average Convergence Divergence (MACD), the Relative Strength Index (RSI), and On-Balance Volume (OBV), among others. Open interest itself is reported weekly for futures markets in the commitment of traders report. Here are a few important points on using technical indicators:
- Fundamental analysis involves evaluating the economic and political factors that affect a country’s currency, while technical analysis focuses only on price data and doesn’t factor in any economic data.
- Technical indicators also help traders assess the direction and strength of trends.
- Traders don’t necessarily rely on just one indicator. Most of the time, they combine a primary indicator with two or more others to get better confirmation and end up on the winning side.
- Keep in mind that each of the indicators covered here has its own unique benefit and is actively used by technical analysts.
- The skills required differ by analysis type – a fundamental analyst needs to read and understand the economy and follow political events, while a technical analyst needs to be comfortable working with charts and technical indicators.
Frequently Asked Questions
What is the Stochastic indicator?
It’s one of the indicators shown in a panel at the bottom of the trading platform. It can be used to get buy or sell signals, identify overbought and oversold zones, and measure momentum.
What is the Relative Strength Index?
It’s a momentum indicator that measures the average of price movements over a set period. It can be used to identify overbought or oversold zones as well as measure momentum.
What is a scalping strategy?
These are strategies based on very short-term trades, ranging from one minute up to a few hours.
What are economic indicators?
These are indicators used to measure economic performance, such as the Consumer Price Index, an important factor in measuring inflation rates, and Gross Domestic Product, an important factor in measuring growth rates.
What types of indicators are there?
There are thousands of technical indicators, but they ultimately fall into just four categories: trend indicators such as moving averages, momentum indicators such as RSI, volatility indicators, and volume indicators. The last group includes a reading built from volume, the bar range and the price move together.
Related: How to Use Volume Indicators in Trading
Fundamental and Technical Analysis: Common Questions
What is the difference between fundamental and technical analysis?
Technical analysis reads price and volume to identify levels, structure and timing. Fundamental analysis in currencies reads the relative position of two economies and two policy paths. One marks where and when, the other suggests why, so they answer different questions rather than competing to answer the same one.
Does fundamental analysis work the same way for currencies as for stocks?
No. The company toolkit does not transfer, because a currency has no earnings, no balance sheet and no shareholders, so measures such as price-to-earnings have no currency equivalent. What carries over is broader: supply and demand, policy, and the interest rate differential between the two currencies.
Is technical analysis only for short-term trading?
No. Trends running for months are read with moving averages and trend structure, which is technical work over quarters. The opposite case is equally common, since scheduled economic releases produce some of the sharpest moves of the day and those are fundamental events traded in seconds. Neither method carries a fixed holding period.
Which is better for forex, fundamental or technical analysis?
The question has no answer as posed, because the two are not substitutes. A reason to expect repricing does not give an entry level, a stop or a position size, and a level gives no reason to act on it. Most approaches use one for direction and the other for execution.
Can you use both at the same time?
Yes, provided each method answers only what it can answer. A workable split lets fundamental work set the direction under consideration and the events to avoid holding through, and technical work set entry, stop and size. The trap is double-counting, where two inputs express the same view and are mistaken for independent confirmation.
Sources checked 31 July 2026: No economic figure, price level, spread, win rate or performance statistic is quoted on this page, so no external data source is relied on. The corrections in this revision are internal consistency fixes rather than sourced claims: the previous version stated that technical analysts work across short, medium and long horizons while fundamental analysts work over the medium or short term, which contradicts the scheduled-release behaviour described on our own economic calendar page. That claim has been removed. An external reference link to an Arabic Wikipedia article was also removed, since every link in the body of an English page here points to another page on this site. Indicator descriptions retained from the earlier version state what each tool computes, not what it is expected to earn.
Disclaimer
This article is for educational purposes only and does not constitute investment advice or a recommendation to buy or sell any financial instrument. Trading forex and CFDs involves leverage and carries a high level of risk, and you can lose more money than you deposit. Some links on this site are affiliate links, meaning we may earn a commission if you sign up through them, at no extra cost to you.