
Quasimodo Pattern: How It Differs From Head and Shoulders

The Quasimodo pattern is entered with an order resting at a marked level, which makes it one of the few chart patterns where the fill is decided by something other than the shape. A level drawn on the chart and a level an order is measured against are not the same number on a currency pair, and the difference between them is the spread.
None of the widely read descriptions of this pattern says which side of the price the level is read on. That question, the structural condition that separates the shape from a head and shoulders, and why no reliability figure attached to it can be checked, are what follow.
Key takeaways
- The pattern describes a sequence in which the last high pushes past the previous high before price turns, which is a yes or no condition rather than a matter of degree.
- Published comparisons against a head and shoulders rest on one shoulder sitting higher or lower than the other, which is a judgement about symmetry and cannot be checked on a real chart.
- MetaTrader 5 documents a Buy Limit as filling at the Ask and a Sell Limit at the Bid, so a level read off a bid-drawn chart is not the level a buy order is measured against.
- That difference is the spread, and on a level-precise entry it decides whether the order fills at all rather than what it costs once filled.
- The same event is described elsewhere as a change of character, so two vocabularies name one thing and neither adds information the other lacks.
Table of contents
- What the Quasimodo Pattern Names
- The One Structural Test Against a Head and Shoulders
- Where the Entry Level Sits, and On Which Side of the Price
- What the Spread Does to a Level-Precise Entry
- Why It Describes the Same Event as a Change of Character
- The Inverted Form, and What Changes
- Why No Reliability Figure Here Is Verifiable
- What to Check Before Trusting a Marked-Up Chart
- Questions Readers Ask About the Quasimodo Pattern
What the Quasimodo Pattern Names
The name covers a sequence of turns rather than a picture. Price makes a high, pulls back to a low, makes a higher high, then falls through that intervening low. What follows is a rally that fails somewhere near the first high, and the entry is placed at a level taken from that earlier structure.
Two things in that sequence do the work. The move through the intervening low says the run that produced the highs has stopped behaving like a run. The failed rally afterwards is what the resting order waits for, and it is the only part a trader participates in, since everything before it has already printed.
The vocabulary around it comes from the same family of terms as supply and demand zones, and the level the order sits at is usually described in those terms. The pattern adds a specific rule for choosing which level, and nothing else.
The One Structural Test Against a Head and Shoulders
Published comparisons separate the two by symmetry. The usual formulation is that a head and shoulders has shoulders of roughly matching height while this pattern does not, one shoulder sitting higher or lower than the other.
That description cannot be applied. Shoulders on a real chart are never the same height, so every head and shoulders is asymmetric by some amount, and the reader is left deciding how much asymmetry is enough. A criterion that resolves to a judgement about degree cannot separate two things, because it never returns a definite answer. The same objection reaches the inverse head and shoulders pattern, where one vendor reference states outright that matching shoulder heights are not required.
The sequence itself offers something that does. In a head and shoulders the final high stays below the highest point of the formation. Here it does not: the second high pushes past the first before price turns. That is a comparison between two numbers already printed on the chart, and it returns yes or no with nothing left to weigh.
This page treats that condition as the working separation, and it is a reframing rather than a sourced definition. No standards body publishes definitions of chart patterns, so nothing here can be checked against an authority. What can be said is that a condition returning yes or no is testable while a description of symmetry is not.
A reader comparing two marked-up charts needs the first kind. The same structural language is used across break of structure and order blocks, where the vocabulary is examined at greater length.
Where the Entry Level Sits, and On Which Side of the Price
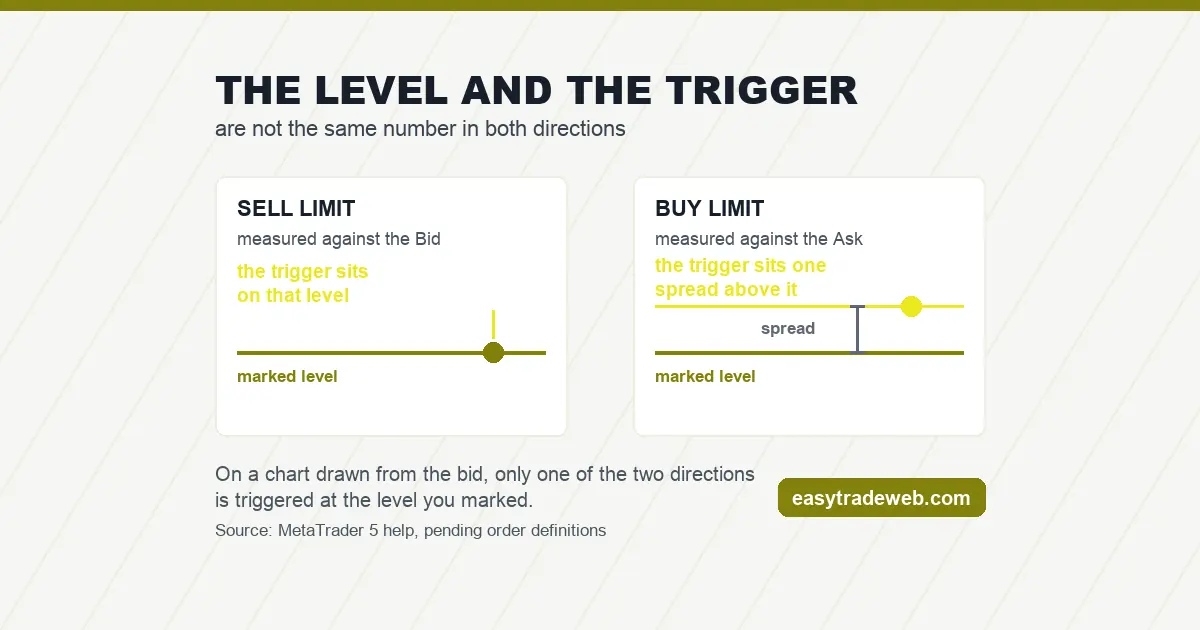
The level is read off the chart, and on the MetaTrader platforms the chart is drawn from one side of the quote. The order placed at that level is measured against the other side. Those two facts together decide whether a marked entry fills.
MetaTrader 5 help gives the rule for each pending order type, and the pattern across all four is simpler than the individual definitions make it look. Every buy order fills on the ask. Every sell order fills on the bid. Whether the order is a limit or a stop changes which direction price has to approach from, and it does not change which side of the quote the fill is taken from.
So a bearish setup entered with a Sell Limit is measured against the bid, and if the chart is drawn on the bid the marked level and the trigger are the same number. A bullish setup entered with a Buy Limit is measured against the ask, and the marked level and the trigger are then a spread apart.
The consequence is one-sided rather than symmetric, which is what makes it easy to miss. The same distance drawn on the same chart behaves differently depending on which way the trade faces, and no amount of care in marking the level changes that. The general mechanism behind it, including which of the four order events reads which side, is set out under which side of the price a level is read on.
| Entry order at a marked level | Price the order is measured against | Level on a bid-drawn chart |
|---|---|---|
| Sell Limit, bearish setup | Bid | Same as the marked level |
| Buy Limit, bullish setup | Ask | A spread away from the marked level |
| Sell Stop | Bid | Same as the marked level |
| Buy Stop | Ask | A spread away from the marked level |
| Which side the chart itself draws | Set in the platform, commonly the bid | Check it before marking anything |
What the Spread Does to a Level-Precise Entry
On most trades the spread is a cost taken at the moment of entry and the position starts marginally behind. On an entry that waits at a fixed level it does something different: it decides whether there is a position at all.
Price has to reach the trigger, and on the side where the trigger sits a spread away from the marked level, the visible price has to travel that extra distance before anything happens. If the rally that the setup is waiting for stops at the marked level exactly, the order on that side never fills, and the chart afterwards shows a level that held and a trade that was never taken.
Nothing about that appears in the equity curve, which is why it is easy to carry a rule for a long time without noticing the asymmetry in it. The trades that did not happen leave no record. A rule tested against marked levels on a chart and a rule run through resting orders are therefore not the same rule, and the second one will take fewer trades in one direction than the first.
This is also the reason a pattern entry can look reliable while performing differently in an account. The setups that failed to fill were the ones where price turned exactly at the level, and those are the ones the marked-up chart presents as the cleanest examples. Related failures at a level, where price passes through and returns, are covered under breakouts that fail.
Why It Describes the Same Event as a Change of Character
The move through the intervening low is the part of the sequence that carries the information, and it has another name. In the market-structure vocabulary the same event is called a change of character: the first turn that breaks the pattern of higher lows a run had been making.
Two vocabularies naming one event is worth knowing, because a reader following both will otherwise count one signal twice. A chart marked with a Quasimodo and the same chart marked with a change of character are not two pieces of evidence. They are one, written down in two notations.
What separates them is scope rather than substance. The structure vocabulary stops at naming the break, and the tools built on it disagree about which break qualifies. This pattern goes further and specifies where the entry goes afterwards, which is the only part of it the other name does not cover.
The Inverted Form, and What Changes
The inverted form is the same sequence upside down. A low, a bounce, a lower low, then a move back up through the intervening high, followed by a decline that fails near the first low. The entry rests at a level taken from that earlier structure, in the same way.
One thing genuinely changes, and it is the part covered above. The bullish version is entered with a buy order, which is measured against the ask, so on a bid-drawn chart the trigger sits a spread away from the marked level rather than on it. The bearish version does not have that problem. The shape is symmetric and the execution is not.
Why No Reliability Figure Here Is Verifiable
Descriptions of this pattern regularly attach language about how dependable it is, and the same sources carry no test behind that language. Across the four substantial articles read for this page, terms describing reliability appear repeatedly while the word backtest appears in none of them.
A figure with no method behind it cannot be checked, corrected or compared, and repeating one from another education page would only move it along. Under the evidence rule this site works to, a number that no source publishes does not appear here at all, so this page states no success rate and no win rate for the pattern.
The absence is worth stating rather than passing over. A reader who has seen a percentage attached to this pattern elsewhere should know that it did not come from a published test, because a figure with no origin is more persuasive than one that is honestly missing.
What to Check Before Trusting a Marked-Up Chart
Marked-up examples are how this pattern is taught, and they are drawn after the outcome is known. Four questions make one testable.
Does the second high actually exceed the first, on the values printed rather than by appearance? Does the sequence break the intervening low before the entry level is drawn, rather than after? Is the level drawn from structure that existed at the time, or from a point that only became visible later? And which side of the price will the entry order be measured against, given the direction of the trade?
The last one is the question that changes what the chart is worth. An example marked on a bid-drawn chart and entered in the bullish direction did not happen at the level shown, and the difference is not visible in the picture. Checking it costs one look at the platform settings.
Questions Readers Ask About the Quasimodo Pattern
What is the Quasimodo pattern in trading?
It is a name for a sequence of turns rather than for a picture. Price makes a high, pulls back to a low, makes a higher high, then falls through that intervening low, and the entry is placed at a level taken from the earlier structure. The term is trader vocabulary and no standards body publishes a definition of it.
How is a Quasimodo pattern confirmed?
Confirmation in the usual descriptions means the move through the intervening low has completed and price has returned toward the marked level. Sources disagree about what counts, and no published test settles which version performs better, so treat any confirmation rule as a convention rather than as a finding.
What is the inverted Quasimodo pattern?
It is the same sequence turned upside down: a low, a bounce, a lower low, then a move back up through the intervening high. The shape mirrors exactly, but the execution does not, because the bullish entry is measured against the ask rather than the bid.
Is a Quasimodo pattern the same as a head and shoulders?
No, and the difference usually given is that one shoulder sits higher or lower than the other, which is a judgement about symmetry. A condition that can be checked is whether the final high pushes past the previous high before price turns. In a head and shoulders it does not.
Which side of the price is the Quasimodo entry level read on?
That depends on the order used. MetaTrader 5 documents a Buy Limit as filling at the Ask and a Sell Limit at the Bid. Where the chart is drawn on the bid, a sell entry sits on the level shown while a buy entry sits a spread away from it.
Risk warning: this page is educational and describes a chart pattern in common use and the order mechanics that interact with it. It is not advice to open, hold or close any position, and recognising a pattern is not a method of producing a profit. A pending order does not guarantee an entry price and a stop order does not guarantee an exit price. Leveraged trading carries a high risk of loss.