
Inverse Head and Shoulders Pattern: What Actually Counts

Two vendor references set out this pattern in writing, and they disagree about the shoulders. One states that matching heights are not required, only that both outer bottoms sit above the middle one. The other places the outer lows at approximately the same level, and most explanations side with the second and harden it into a rule.
The disagreement matters because the shape you draw by eye and the shape a scanner flags are tested against different conditions. A scanner applies a pivot rule, a fixed lookback window and a closing price, and it will pass over a formation you can see perfectly well.
What follows is what each documented definition requires, where the two diverge, and what a central bank did when it tested the pattern on currencies.
Key takeaways
- The Schwab thinkorswim pattern reference states that the two shoulders are not required to be of the same height, only that both sit above the head.
- TradingView’s automated pattern tool does not match that wording and places the outer lows at approximately the same level, so the two written definitions are not interchangeable.
- That tool searches the last 600 bars and requires the pattern points to sit on 5/5 pivots, which is why a shape you can see may never be flagged.
- Completion is a close above the neckline, and the tool then applies one of four statuses, including Failed when price falls back below the right shoulder.
- The Federal Reserve Bank of New York tested a head-and-shoulders trading rule on daily major-currency rates from March 1973 to June 1994 against 10,000 bootstrapped random-walk series.
Table of contents
- Your Shoulders Do Not Have to Match
- The Three Lows and the Line Drawn Above Them
- What a Pattern Scanner Checks That Your Eye Does Not
- Awaiting, Reached, Failed: the Verdict a Screener Puts on Your Chart
- The Inverse Is Not a Mirror Image of the Standard Pattern
- What a Central Bank Tested, and What Its Report Does Not Say
- Questions Readers Ask About This Pattern
- Five Checks Before You Trade the Shape
Your Shoulders Do Not Have to Match
The Schwab thinkorswim classic-pattern reference puts the requirement in one line. The first and third bottoms have to be higher than the head, and they are not required to be of the same height. Nothing in that reference asks for symmetry between the two shoulders.
Two of the three article-length explanations read for this page treat unequal shoulders as a defect. One lists shoulder misalignment among the common mistakes and wants the right shoulder to finish close to wherever the left one did; another tells the reader to step back when the shoulders are wildly asymmetric. Both present that as a validity test rather than a preference.
TradingView’s automated tool leans their way without settling it, placing the first and third lows at approximately the same level above the head. The disagreement therefore runs between two vendor definitions, and a reader following one of them will reject formations the other accepts.
The condition both references share is the one to check first: both shoulders sit above the head, and the head is the lowest of the three.
Schwab’s reference adds a second relationship worth holding on to, describing the move after the breakout as proportional to the decline that preceded the pattern. A shape formed after a shallow drift is not making the same claim as one formed after a long fall. The same tension between a drawn shape and a defined one runs through the Quasimodo pattern, built from the same geometry with one swing moved.
The Three Lows and the Line Drawn Above Them
The formation is three consecutive lows separated by two intermediate highs. The middle low is the deepest and keeps the name head even though it points down. The two outer lows are the shoulders.
The neckline is drawn along the two intermediate highs, above the pattern rather than below it. That is the line the price has to clear, and until it does, the tool that drew the shape does not treat the pattern as complete.
Schwab’s reference does not require that line to run flat. It goes further and credits a downward slope with adding to how the pattern performs, which is worth reading twice: a sloping neckline is often presented elsewhere as a flaw to screen out rather than as a feature.
For the target, TradingView gives one measurement: the expected move above the neckline is approximately the height of the head, taken from the head up to the neckline and projected from the point where price clears the line. A shallow head therefore implies a small target, whatever the chart looks like at a glance. Where three lows sit at roughly one level instead of one deep centre, the shape is a triple bottom and its measurement differs.
What a Pattern Scanner Checks That Your Eye Does Not
An automated pattern tool cannot look at a chart. It applies arithmetic tests, and TradingView documents the ones its Auto Chart Patterns indicator uses.
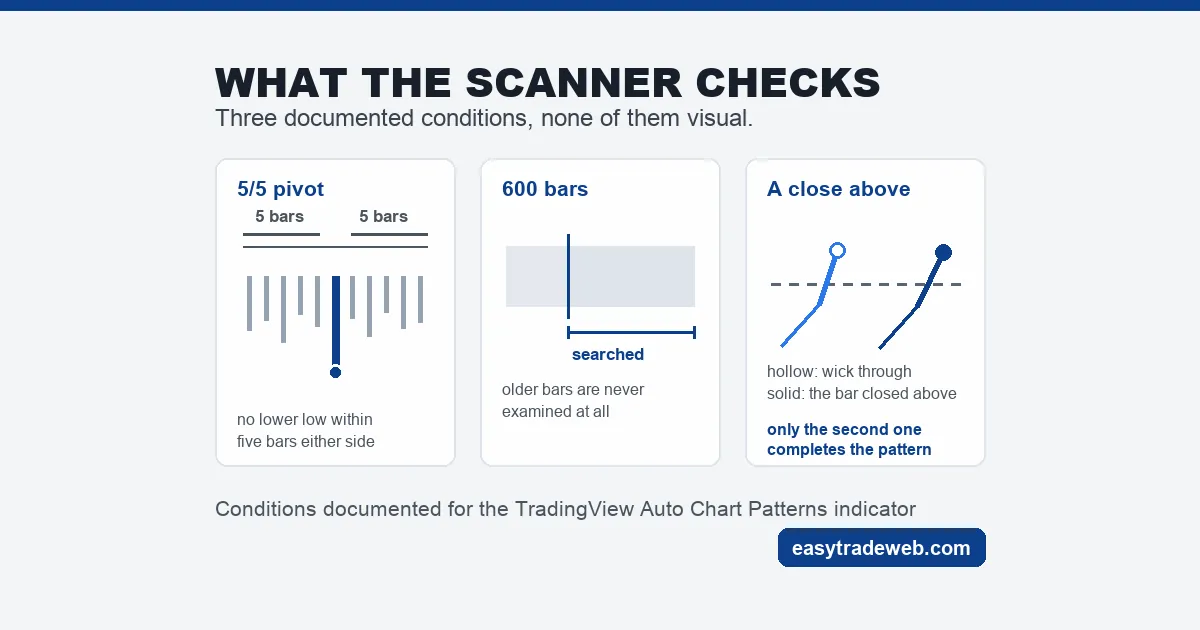
The first test is the pivot. A point counts as a 5/5 pivot high when no higher high sits within five bars to its left or five bars to its right, and the mirror condition defines a pivot low. Every point that anchors the pattern, other than the final one, has to sit on a 5/5 pivot. The last point is placed where the closing price line meets the neckline rather than on a pivot of its own.
The second test is the window. The indicator searches the last 600 bars and nothing before that, so a formation that completed earlier in the chart history is outside what the tool examines and its absence from the list says nothing about whether it existed.
The third test is the close. The pattern is treated as formed when, after the right shoulder, the closing price rises above the neckline, so an intrabar spike through the line and back does not count. A separate In Progress mode shows patterns still building, where the right shoulder has not yet reached a pivot and the lines are drawn dotted.
Together those tests explain the common complaint that a screener misses an obvious pattern. A turn only three bars wide never becomes a pivot, a shape near the left edge of the window is not searched, and a move that pierces the neckline and closes back under it has not completed. None of that makes the drawn shape wrong. It does mean two people reading one chart, one by eye and one through a scanner, are answering different questions.
| Condition | Schwab thinkorswim pattern reference | TradingView Auto Chart Patterns |
|---|---|---|
| Shoulder heights | Not required to match; both above the head | Approximately the same level above the head |
| Neckline slope | Not required to be horizontal; a downward slope adds to performance | Drawn through the intermediate highs, slope not specified |
| What completes it | A breakout above the neckline | A closing price above the neckline after the right shoulder |
| Where the target comes from | Rise described as proportional to the preceding decline | Approximately the height of the head |
| How far back it looks | Not stated | The last 600 bars |
| Unformed shapes | Not addressed | Shown in In Progress mode with dotted lines |
Awaiting, Reached, Failed: the Verdict a Screener Puts on Your Chart
Once the tool has drawn a completed pattern it attaches a target label, and that label carries one of four statuses. Awaiting means price has neither reached the expected level nor dropped below the right shoulder. Reached means the expected level was hit. Failed means price did not reach the level and went below the right shoulder instead. Indefinable is what the tool reports when it cannot decide between them.
The definition of Failed is the useful part, because it is a price and not an opinion. The pattern is treated as having failed at a specific level, the low of the right shoulder, which is the same level most written descriptions put a stop beneath. Here that level is doing two jobs at once: it decides whether the shape is still a valid pattern and it decides whether the trade is still on.
One more rule sits behind the display. Where two patterns intersect, the tool shows the one whose status is Awaiting in preference to the other, so a chart that appears to hold one clean pattern may be holding two with the second suppressed. That is a display rule, not a judgement about which shape is better, and treating the surviving label as confirmation repeats the mistake the page on false breakouts works through.
The Inverse Is Not a Mirror Image of the Standard Pattern
Almost every description opens by calling this formation the opposite of the head and shoulders top. The geometry is indeed reflected, but the Schwab reference does not treat the two as equivalent in behaviour, and it says so in two places.
First, while the inverse shares the geometry principles of the standard pattern, the reference describes it as statistically less reliable. That is a plain statement about the two patterns, not a hedge about technical analysis generally.
Second, the retest behaviour differs. The reference says the inverse pattern’s tendency toward throwbacks is significantly less pronounced than the standard pattern’s tendency toward pullbacks. A plan built entirely on waiting for price to come back and retest the neckline is therefore built on an event that the reference expects less often here than in the version most retest advice was written for.
Volume gets a similar treatment. The reference gives the same volume shape for both patterns, highest on the left and trending down, but notes that in the inverse case this describes the better conditions, whereas rising volume is usually preferred in the standard top.
Reading across from one pattern to the other changes the answer more often than the mirror-image framing suggests, and the island reversal is another formation that behaves differently at tops and bottoms.
What a Central Bank Tested, and What Its Report Does Not Say
The head-and-shoulders pattern has been tested by a central bank research department. In August 1995 the Federal Reserve Bank of New York published Staff Report 4, written by Osler and Chang and called Head and Shoulders: Not Just a Flaky Pattern.
The method is stated in the report’s own summary. A trading rule based on the pattern was applied to daily exchange rates of major currencies against the dollar from March 1973 to June 1994, with patterns identified by an objective computer-implemented algorithm built from criteria in published technical analysis manuals.
The profits that rule produced were compared against the distribution of profits from 10,000 simulated series generated by bootstrap under a random-walk null hypothesis. A later version appeared in the Economic Journal in October 1999.
What this page does not give you is the result. The file the New York Fed serves is a scanned image with no extractable text, so its numbers were not read here and none are quoted. The report is named in full above for anyone who wants those figures at the source.
The part that transfers without a single number is the method. Before the pattern could be tested it had to be written as an algorithm, which is the step a screener takes and the step a hand-drawn shape skips. The page on how to backtest a trading strategy sets out what has to be fixed before any such test means anything.
Questions Readers Ask About This Pattern
Does an inverse head and shoulders point up or down?
Up. The pattern forms as three lows with the deepest in the middle, and the line it has to clear sits above the shape rather than below it. The Schwab reference describes it as signifying a major reversal when it appears in a downtrend. Direction is the one thing every documented definition agrees on, which is not true of the shoulder heights or the neckline slope.
Do the two shoulders have to be the same height?
The Schwab thinkorswim pattern reference states that they do not, and asks only that both sit higher than the head. The automated TradingView tool describes them at approximately the same level, so a scanner built on that description may skip a formation the written reference accepts. Both shoulders above the head is the condition the two share.
Why did my screener not flag a pattern I can clearly see?
Three documented conditions account for most cases. The turning points have to be 5/5 pivots, meaning no higher high within five bars either side for a pivot high, so a narrow turn does not qualify. The search covers the last 600 bars, so an older formation is outside the window. And completion needs a closing price above the neckline, so a spike through the line that closes back below leaves the pattern unformed.
Is the inverse version more reliable than the standard head and shoulders?
The Schwab reference says the opposite. It describes the inverse pattern as statistically less reliable while sharing the geometry of the standard pattern, and says the inverse shows a much weaker tendency toward throwbacks than the standard shows toward pullbacks. Advice written for one and applied to the other carries an assumption the reference does not support.
How far back does a pattern scanner look for the shape?
TradingView documents a 600-bar window for its Auto Chart Patterns indicator. That is a bar count rather than a period of time, so the calendar span changes with the timeframe: 600 daily candles cover roughly two and a half years, 600 hourly ones about a month. A pattern outside that window is never examined.
Five Checks Before You Trade the Shape
Each check is answerable from the chart in front of you, and each comes from a documented condition rather than a preference.
- Confirm both outer lows sit above the middle low. That is the condition both written definitions share, and it is the only structural test they agree on.
- Find the two intermediate highs and draw the neckline through them. If the line slopes, note the direction rather than discarding the pattern.
- Check whether price has closed above that line, not merely touched it. Until a close prints above the neckline, the pattern is provisional.
- Measure the head to the neckline and project that distance up from the breakout, so the target is a number before the trade.
- Mark the low of the right shoulder. That level is where the documented status changes to Failed, so it is where the reasoning for the trade ends.
Risk warning: this page is educational and describes how a chart pattern is defined in platform documentation and in published research. It is not advice to buy, sell or hold any instrument, and no pattern produces a profit because it has been identified correctly. A completed pattern can fail at the level its own definition sets, and leveraged exposure to currency markets carries a high risk of loss.