
Sector Rotation Strategy: What It Actually Rotates Between

A sector rotation strategy moves money out of one part of the equity market and into another as conditions change. The usual explanation names eleven sectors, maps them onto phases of the economic cycle, and points at a set of exchange traded funds that track them. Every step in that chain rests on a definition someone else wrote, and the definitions are rarely shown to the reader.
Two of them decide whether the strategy does what the reader thinks. The word sector belongs to a classification scheme, and the major schemes do not use it to mean the same thing. The funds most often named as the way to trade the idea are built from the members of one index, not from the market.
What follows works through what a rotation strategy moves between, who assigns the labels it moves between, what the tracking funds actually hold, which part of the cycle story is evidence and which part is a hypothesis, and what the whole method asks of a leveraged retail account.
Key takeaways
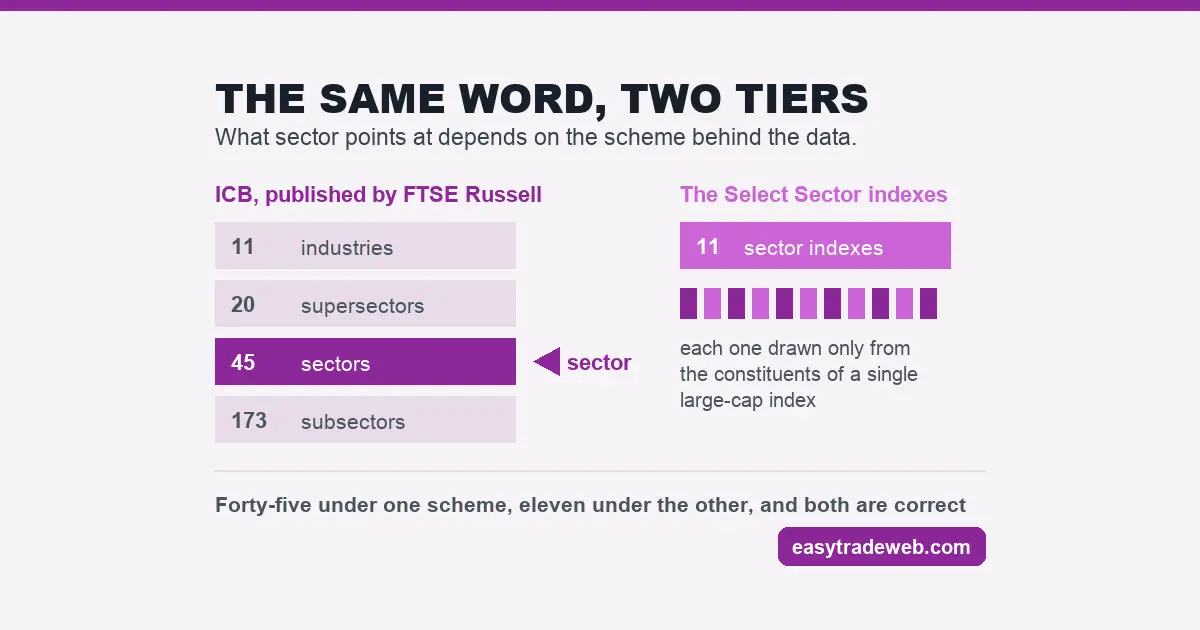
- Sector is a scheme-defined label, not a market fact. FTSE Russell publishes the Industry Classification Benchmark as a four-tier system whose top tier holds 11 industries and whose sector tier holds 45, so the same word points at two different levels depending on the provider.
- A summary prospectus filed with the SEC in January 2026 describes the Communication Services index as one of eleven Select Sector indexes, and states that every component security is a constituent of the S&P 500 Index. Rotating through those funds rotates through large caps only.
- The same filing shows the sector label itself comes from the Global Industry Classification Standard, and the S&P Dow Jones Indices weighting is a modified market capitalisation method rather than a plain one.
- The cycle mapping that most explanations lead with is a hypothesis about averages. The dating of a phase is published after the fact, which is a different problem from whether the mapping holds.
- None of the five comparables read for this page named a second classification scheme, stated the index universe behind the funds, or addressed what the method costs to run on a leveraged account.
Table of contents
- What a Sector Rotation Strategy Moves Between
- Who Decides What Counts as a Sector
- The Eleven Sector Funds Hold One Index, Not the Market
- The Cycle Map, and the Part of It That Is a Hypothesis
- Reading Rotation Needs a Benchmark Before It Needs a Chart
- What the Method Asks of a Leveraged Retail Account
- When the Sector Map Itself Is Revised
- What Would Have to Be True for This to Work
What a Sector Rotation Strategy Moves Between
The method holds the total amount invested roughly steady and changes where inside the equity market that amount sits. Capital leaves the groups expected to lag and goes to the groups expected to lead, and the switch is repeated on a schedule or on a signal. Nothing about it requires a view on whether the market as a whole rises.
That makes it a relative bet rather than a directional one. A rotation that is right about which groups lead can still lose money in a falling market, and a rotation that is wrong can still make money in a rising one. The two outcomes are separate, and a track record that does not separate them is reporting the market and the method as one number.
The groups are the whole question. A rotation strategy needs a partition of the market into buckets, a rule for ranking the buckets, and an instrument for holding each bucket. Most published explanations spend nearly all their space on the second of those three and treat the first and third as settled.
They are not settled. The partition comes from a commercial classification scheme, and the instruments come from a fund family built on a specific index. Both choices narrow what the strategy can express, and both are made before any ranking rule is applied.
Who Decides What Counts as a Sector
Sector is not a property a company has. It is a label assigned by a classification provider according to published rules, and more than one provider publishes rules. The count of sectors a reader has seen quoted depends entirely on which provider that source was using.
FTSE Russell sets out the Industry Classification Benchmark as a four-tier taxonomy. Its own description of the structure gives 11 industries at the top, 20 supersectors below that, 45 sectors below that, and 173 subsectors at the base. Under those rules the word sector names the third tier and has 45 members, while the eleven at the top are called industries.
That scheme is not marginal. FTSE Russell names nine stock exchanges that categorise their listed companies under it, spread across the United Kingdom, continental Europe, Switzerland, Greece, Cyprus, South Africa and Kuwait. A reader working from a listing outside the United States is quite likely reading a classification where sector means one of forty-five.
The eleven that most rotation articles describe come from the Global Industry Classification Standard instead. Both schemes are legitimate and both are internally consistent. What does not survive is the idea that eleven is a fact about markets rather than a fact about one taxonomy.
The practical consequence is narrow and checkable. Before a rotation rule can be tested or run, the scheme behind the data has to be identified, because two dashboards can disagree about which bucket a company sits in and about how many buckets exist at all. That is a question for the data provider, and it has an answer.
| Question | Where the answer comes from | Why it changes the strategy |
|---|---|---|
| How many buckets exist | The classification scheme the data uses | Sets how concentrated each holding is |
| Which bucket a company sits in | The provider rules for that scheme | Two schemes can place the same firm differently |
| Which companies are eligible at all | The index the tracking fund follows | Decides the size range the strategy can reach |
| How much of each company is held | The index weighting method | A bucket can be dominated by a few names |
The Eleven Sector Funds Hold One Index, Not the Market
The instruments almost always named as the way to run the strategy are the sector exchange traded funds that track the Select Sector indexes. What those indexes contain is a matter of public record, because the funds file their prospectuses with the SEC.
The summary prospectus for the Communication Services fund in that family, filed on 30 January 2026, describes its index as one of eleven Select Sector indexes and gives the criteria they are built under. The first criterion is that every component security in the index is a constituent of the S&P 500 Index.
The second criterion is that the index is calculated by S&P Dow Jones Indices using a modified market capitalisation method, which allows the weights of single stock concentrations to be adjusted.
Two things follow, and neither appeared in any comparable read for this page. Rotating across those eleven funds is rotating inside one large capitalisation index, so the strategy holds no mid cap and no small cap exposure at any point in the cycle. If the reason for rotating was that smaller companies behave differently early in a recovery, these instruments cannot express it.
The second is that a sector bucket is not an equal slice of an industry. Weighting by adjusted market capitalisation means a bucket can be carried by a small number of large members, so a position taken on a sector view can behave like a position on a handful of companies. The same filing shows how the label is assigned, naming the Global Industry Classification Standard as the source that identifies the companies in question.
None of this makes the funds unsuitable. It makes their universe a stated fact that belongs in the strategy description rather than an assumption hidden inside it. Anyone extending the idea to other markets is choosing a different index and should read that one, and the same reasoning applies to trading an index of any kind.
The Cycle Map, and the Part of It That Is a Hypothesis
The familiar version of the strategy pairs each phase of the economic cycle with the groups said to lead during it. Defensive groups are placed in slowdowns, cyclical groups in recoveries, and the reader is invited to rotate as the economy moves through the sequence.
Two separate claims are bundled together there. The first is that the phases exist and can be identified, which is a question about measurement and dating. The second is that the pairing between phase and leadership holds reliably enough to act on, which is a question about evidence.
Only the second belongs on this page. How a phase is defined, which indicators decide it, and how long after the fact the label arrives are all set out in detail on the page covering how a cycle phase is actually dated, and that page is the place to settle them.
On the evidence, the honest description is that the mapping is a generalisation drawn from averages across past cycles. Averages across cycles are compatible with any individual cycle behaving differently, and a rotation rule is run on one cycle at a time. Treating the map as a schedule rather than a tendency is where the method most often fails on contact.
Relationships between asset classes shift with the same conditions, which is why the cycle question rarely stays inside equities for long. That broader reading is the subject of intermarket analysis.
Reading Rotation Needs a Benchmark Before It Needs a Chart
Rotation is visible only in relative terms. A sector rising says nothing on its own, because a rising market lifts most sectors, and the question the strategy asks is which ones are rising faster than the reference.
That makes the reference the first decision rather than a detail of presentation. Measured against a broad index, a sector can read as leading; measured against a narrower one, the same sector over the same weeks can read as lagging. The data has not changed and the conclusion has, which is a property of ratios rather than a flaw in any particular tool.
The consequence for anyone comparing two rotation dashboards is that the readings are only comparable when the benchmark and the lookback window are the same on both. Where the specific mechanics of plotting relative strength and momentum are concerned, the relative rotation graph page covers the axes, the tail and what the chart cannot show.
What belongs here is the prior step. A rotation signal is a statement about one thing measured against another thing, and the second thing is chosen. Writing it down before the first trade is what makes the later readings mean anything.
What the Method Asks of a Leveraged Retail Account
Everything above describes an investment method built for cash accounts holding funds. Readers arriving from a leveraged trading platform face a different set of constraints, and none of the comparables read for this page addressed them at all.
The first is availability. Whether any sector instrument can be traded in a given account depends on what that broker lists and on the regulated entity the client was onboarded to, and that is settled by reading the instrument list in the platform rather than by assuming the fund family is reachable.
The second is holding cost. A rotation held for weeks or months on a leveraged product accrues overnight financing for every night it stays open, which is charged whether the position moves or not. A method whose expected edge is a modest difference in relative performance can be consumed by a cost that accrues on the clock.
The third is what leverage does to a relative bet. The gap between a leading sector and a lagging one is usually small compared with the movement of the market itself, so leverage large enough to make the gap meaningful is also large enough to make the market movement dangerous.
Products designed to amplify a daily move, discussed on the page covering leveraged and inverse ETFs, compound that further and are built around a daily reset rather than a multi-week hold.
A reasonable reading is that the strategy transfers poorly to a leveraged short-horizon account, and that the version worth studying is the unleveraged one. That conclusion is available before any money is committed, from the contract specification and the financing table.
When the Sector Map Itself Is Revised
Classification schemes are maintained, and maintenance means the structure changes. Tiers are added, groups are split, and companies move between buckets when the rules that place them are revised. A scheme that never changed would be describing an economy that never changed.
That creates a problem for any long backtest of a rotation rule. A test run over decades is rotating through a set of buckets that did not exist in that form for the whole period, and the historical series has to be either reconstructed under current rules or spliced across revisions. Which of the two was done changes the result, and a performance table that does not say has left out the assumption that matters most.
The same applies to a live strategy at a smaller scale. A holding can change sector without the company changing, and a rule that rebalances on sector membership will act on that reclassification as though it were information about the business.
The check is straightforward. Any published record of a rotation rule should state which classification scheme it used, over which period, and how revisions inside that period were handled. A record that states none of the three is not testable by a reader.
What Would Have to Be True for This to Work
The method is coherent, and it rests on conditions a reader can check rather than on a claim to be evaluated as a whole. Four of them do most of the work.
The leadership pattern would have to hold in the current cycle and not only on average across past ones, and the phase would have to be identifiable early enough to act on rather than only in hindsight. The buckets would have to be the ones intended, which means knowing the scheme behind the data and the index behind the instruments.
The cost of switching would have to stay small against the expected difference in performance, which is an arithmetic question rather than a market view.
Each of those is answerable in advance, and three of the four are answerable from documents rather than from opinion. The classification structure is published by the provider. The index universe and the weighting method are in the fund prospectus. The switching cost is in the fee schedule and, on a leveraged account, in the financing table.
What is left after those three is the one genuinely open question, which is whether the leadership pattern repeats. That is where a reader should spend the uncertainty, rather than on the parts that were settled in public all along.
Risk warning: this page is educational and explains how sector classifications, index universes and rotation rules are defined. It is not advice to buy, sell or hold any fund, sector or security, and no rotation rule produces a profit because it is followed consistently. Relative performance between sectors can reverse without the market as a whole moving, and leveraged exposure to that gap carries a high risk of loss.