
Ulcer Index Explained: Drawdown Depth and Time Combined

A maximum drawdown figure answers one question: how far did the account fall. It says nothing about how long the account stayed down there, and a fall of twenty percent that recovers in a fortnight is not the same experience as a fall of twenty percent that lasts a year.
The ulcer index was built to put both properties into one number. It is also, on a trading account, the harder of the two to obtain, because no retail platform reports it and two different measurements circulate under the same name.
Key takeaways
- Peter Martin developed the measure in 1987. Each period is scored by how far it sits under the running high, those scores are squared, averaged across the whole series and rooted back. Every period below the previous peak contributes, so time spent underwater is counted rather than discarded.
- Two different measurements share the name. Martin defines a statistic over a whole evaluated record; charting packages document a rolling indicator with a short lookback plotted beneath a price series. The two are not comparable figures.
- Martin states that the value is essentially the same across a wide range of sampling intervals, which is the property a maximum drawdown does not have. Weekly data is described as robust, and intervals of a quarter or longer are discouraged.
- The Martin ratio, which Martin calls the Ulcer Performance Index, divides excess return by the ulcer index. Excess return is total return minus what a risk-free holding would have paid.
- MetaTrader reports no ulcer index in its strategy tester output, so on a trading account the figure has to be built from an equity series the trader samples themselves.
Table of contents
- What the Ulcer Index Measures That a Drawdown Figure Does Not
- Which Question You Are Asking: Depth, Duration, or Both
- Two Different Measurements Share This Name
- The Squaring, and Why the Sampling Interval Stops Mattering
- What It Takes to Compute One on a Trading Account
- The Martin Ratio, and What Sits in Its Denominator
- Who This Page Is Not For
What the Ulcer Index Measures That a Drawdown Figure Does Not
Take a series of account values and mark, at every point, how far below its own running high the account sits. Most of those readings will be zero, because the account is at a new high. The rest are negative, and they are what the index consumes.
Square each of those shortfalls, average the squares across every period in the series, and take the square root of that average. That construction comes from Peter Martin, who developed the measure in 1987.
Two consequences follow immediately. A period spent at a new high contributes nothing, so a strategy that keeps making highs is not penalised for volatility on the way up. And every period below a high contributes, not only the worst one, so an account that sits eight percent down for nine months scores worse than one that touches minus eighteen percent for a week.
That second consequence is the whole difference from maximum drawdown, which reads only the single deepest point and discards everything around it.
Which Question You Are Asking: Depth, Duration, or Both
These measures are not competitors and the choice between them is not a matter of which is better. Each answers a different question, and the useful step is deciding which question is being asked before reaching for a number.
| The question | The measure that answers it | What it ignores |
|---|---|---|
| How close did the account come to a limit or a stop out | Maximum drawdown | How long the account stayed down |
| How long was this uncomfortable to hold | Ulcer index | The single worst instant, which it blends into the average |
| How dispersed were the returns overall | Standard deviation, as used by the Sharpe ratio | Direction, since gains widen it as much as losses |
An account governed by a hard loss limit, on a funded programme or through a broker margin rule, is being asked the first question and nothing else. The limit is breached at an instant, and a measure that averages across time cannot see that instant coming.
A trader deciding whether they can actually stay with a strategy is asking the second. That decision is made over months of sitting below a previous high, and the deepest single point is a poor summary of it. The Sharpe ratio answers neither, because it treats an upward surge as risk.
Two Different Measurements Share This Name
Martin defines the index over a whole evaluated record, so the average runs across every period in the series being judged. Charting packages document something else under the same name: a rolling indicator with a short lookback, recomputed at every bar and plotted beneath a price chart.
Both are legitimate and they are not interchangeable. A rolling reading answers what the last handful of bars looked like. A whole-record figure answers what holding this thing was like over the period examined.
The practical hazard is comparison. A reading lifted from a chart indicator and a figure quoted in a fund document are two different objects, and neither states which one it is because each treats its own version as the obvious meaning. Nothing in either name distinguishes them.
Before comparing two ulcer index figures, establish for each one what series it was computed over and how many periods went into the average. Where that cannot be established, the comparison is not available.
The Squaring, and Why the Sampling Interval Stops Mattering
The squaring step is not presentational. Martin states that it penalises large drawdowns proportionately more than small ones, which is exactly what separates the index from a plain average of the shortfalls.
A plain average would treat ten periods at minus two percent as equivalent to one period at minus twenty. Squaring breaks that equivalence and pushes the deep episodes up the scale, while still counting the shallow ones that a maximum drawdown throws away entirely.
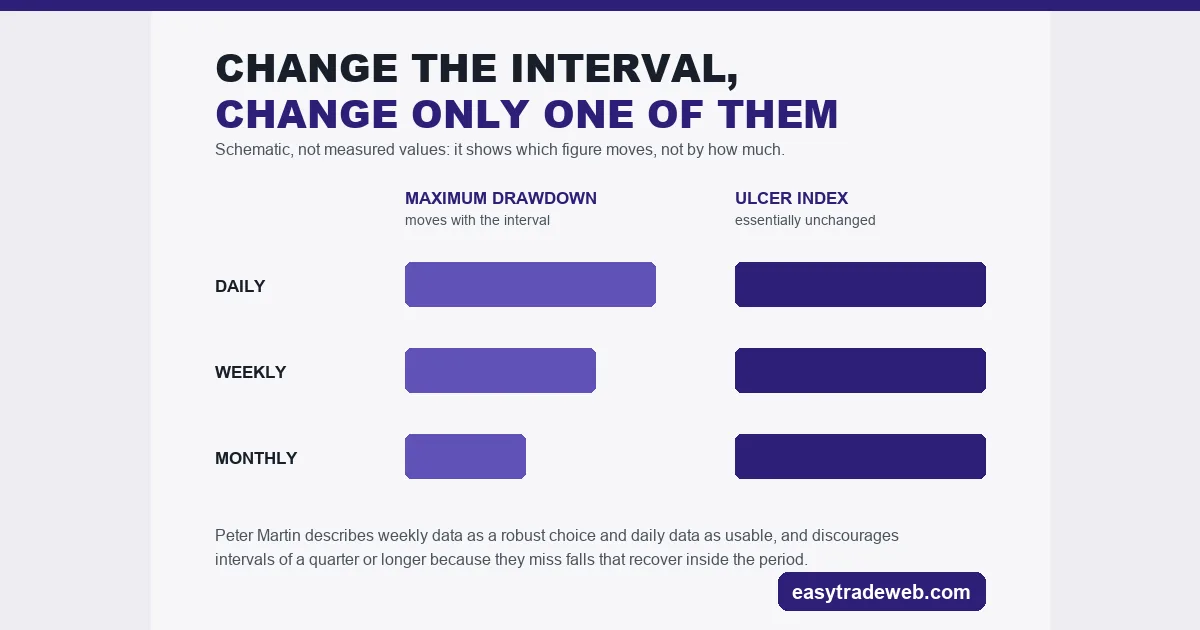
The second property is the one that matters most on a trading account. Martin states that the calculated value is essentially the same across a wide range of intervals between data points, describes weekly data as a robust choice, notes that daily data works, and discourages intervals of a quarter or longer because they miss drawdown-and-recovery episodes inside the period.
Set that against a maximum drawdown, whose answer moves with the sampling interval by construction: a figure taken from month-end values can only ever see month-end lows. The same choice that quietly changes one number leaves the other roughly where it was, which is a reason to compute both rather than to pick one.
What It Takes to Compute One on a Trading Account
Every published description of this index works on a price series or a fund value. A trading account is a different object and three things have to be settled before the formula applies at all.
The first is what is being sampled. On a leveraged account the meaningful series is equity rather than balance, because balance ignores open positions and an account can sit far below its high on equity while its balance has not moved. The tester output for a strategy reports both, and only one of them describes what the account was actually worth.
The second is the interval. An account produces values continuously, so the series has to be sampled deliberately rather than taken as it comes. Martin describes weekly as robust and daily as usable, and the invariance above means the choice inside that range is not delicate.
The third is that the platform will not do it. MetaTrader reports drawdown depth in its strategy tester and reports no ulcer index anywhere, so the figure has to be built from an exported equity series. That is a spreadsheet exercise, not a platform setting.
The Martin Ratio, and What Sits in Its Denominator
Martin pairs the index with a performance measure he calls the Ulcer Performance Index, and which is also circulated as the Martin ratio. The two names describe the same construction.
It divides excess return by the ulcer index, where excess return is total return minus what a risk-free holding would have paid over the same stretch. The shape is familiar from the Sortino ratio and its relatives: a return figure on top, a chosen definition of risk underneath.
What changes is the ranking that comes out. A denominator built from time spent underwater rewards a strategy that recovers quickly and punishes one that grinds sideways below a previous high, even where both reached the same worst point. That is a different ordering from any measure whose denominator is a single deepest fall.
Who This Page Is Not For
Anyone searching this term for a medical meaning is in the wrong place. The phrase is used in pharmacology for something unrelated, and nothing here applies to it.
A trader who needs to know how close an account came to a stop out is also better served elsewhere. That is a question about a single instant, and this measure is built to blur instants into an average on purpose.
Where it earns its place is the decision about whether a strategy is one a trader can hold. Compute it on an exported equity series, at a stated interval, over a stated record, and read it beside a depth figure rather than instead of one.
Frequently Asked Questions
How is the ulcer index calculated?
Measure how far the value sits below its own running high at every point in the series, square each of those shortfalls, average the squares over every period, and take the square root of that average. Periods sitting at a new high contribute zero. Peter Martin, who developed the measure, describes it in exactly that construction.
How does the ulcer index differ from maximum drawdown?
A maximum drawdown reports the single deepest fall and discards everything else, so it answers how close the account came to a limit. The ulcer index counts every period spent below a previous high, so it answers how long the position was uncomfortable to hold. Two records with an identical maximum drawdown can have very different ulcer index values.
What is the martin ratio?
It is the same measure Peter Martin calls the Ulcer Performance Index. It divides excess return by the ulcer index, where excess return means total return minus what a risk-free holding would have paid over the same period. Because the denominator counts time underwater, it ranks a fast recovery above a long flat stretch below a previous high.
Which period does an ulcer index need?
Martin states that the value stays essentially the same across a wide range of intervals between data points, calls weekly data a robust choice and notes daily data can be used, while discouraging intervals of a quarter or longer because those miss falls that recover inside the period. What matters far more is stating which record the figure covers, since a rolling chart reading and a whole-record figure are different measurements.
Risk warning: this page is educational and explains how a risk measure is constructed and what it can and cannot show. It is not advice to buy or sell any instrument, it recommends no product, platform or broker, and nothing here is a signal, a performance claim or a prediction. Past or simulated performance figures do not indicate future results, and leveraged trading carries a high risk of losing money.