
Broadening Formation: Why the Megaphone Is Hard to Trade

A broadening formation is one of the few chart shapes that gets harder to trade the longer it holds. Most patterns tighten as they mature, so each successive swing costs less to be wrong about. This one does the opposite: every swing is wider than the one before it.
Five guides were read for this page. All five use broadening formation, megaphone, broadening top, expanding triangle and broadening wedge as though they were five names for one shape. They are not. And all five give the same two ways to trade it without once connecting the widening geometry to the size of the position.
What follows separates the constructs that are being run together, then works out on the page what the widening actually does to risk.
Key takeaways
- Broadening top, expanding triangle and broadening wedge are three different constructs with three different rule sets, not three names for one pattern.
- The classical megaphone is defined by an alternating-touch convention alone. It carries no internal structure requirement and no directional bias.
- Because each swing is wider than the last, a fixed lot size risks more on every successive entry while the opposite boundary moves further away.
- Holding risk constant across the pattern requires the position to shrink on each swing, which is the reverse of what a fixed-lot approach does by default.
- The touch counts, pullback rates and target rules quoted for this pattern are drawing conventions. No study, dataset or methodology is named on any of the five guides read here.
Table of contents
- What a Broadening Formation Is on the Chart
- Five Names, Three Different Patterns
- Why a Widening Structure Breaks Fixed-Size Risk
- Telling a Real Megaphone From Four Badly Placed Trendlines
- What the Popular Numbers Are and Are Not
- Who Should Leave This Pattern Alone
- Before You Call It a Broadening Formation
What a Broadening Formation Is on the Chart
The shape is two boundaries that diverge. An upper line connects successive highs and slopes up; a lower line connects successive lows and slopes down. Price alternates between them, reaching further each time, so the distance between the two lines grows as the structure develops.
The convention that identifies it is alternating touches: a high, then a low, then a higher high, then a lower low. Each new extreme sits beyond the previous one on its own side. That alternation is the whole definition of the classical form, and it is worth being clear that it is a convention for drawing rather than a measured property of price.
What the widening describes is a market where neither side is settling. In a contracting pattern the range compresses because buyers and sellers are converging on a price. Here they are moving apart: each rally is bought further up and each decline is sold further down, and the disagreement is getting wider rather than resolving.
Because both boundaries are drawn through successive extremes rather than through a settled level, the lines are only as reliable as the touches behind them. That is the same constraint that governs any sloped boundary, and it is covered in more detail in how a trend line is drawn.
Five Names, Three Different Patterns
The five guides read for this page move between the names freely, and a reader who takes them as synonyms will apply one construct’s rules to another construct’s shape. Three separate things are being named.
The first is the classical broadening top or megaphone. It is defined by the alternating-touch convention and by nothing else. There is no requirement about what happens inside the structure, no count of internal legs, and no bias built into the shape, because both boundaries diverge symmetrically from the same origin.
The second is the expanding triangle of Elliott Wave. That is a corrective structure with a five-leg count and labelling rules that determine whether a given widening shape qualifies at all. It is the same geometry seen through a framework that adds requirements the classical reading does not have. This page states only the classical reading and reproduces none of those rules; the wave-labelling treatment, including the variants, is set out separately in the expanding triangle in Elliott Wave.
The third is the broadening wedge. Here both boundaries slope the same way while still diverging, so the structure leans. That lean is a directional characteristic the symmetrical megaphone does not have, which is why treating the two as one name loses the only feature that distinguishes them. The mirror case, where both boundaries slope the same way and converge, is a contracting wedge.
The practical cost of the confusion runs in both directions. A reader who applies wave rules to a classical megaphone is looking for structure the shape never promised. A reader who reads directional bias into a symmetrical broadening top has imported it from the wedge, where it belongs.
Why a Widening Structure Breaks Fixed-Size Risk
Every one of the five guides offers the same two approaches: trade the swings between the boundaries, or wait for a breakout. Not one of them connects the widening to position size, and that connection is where the pattern’s real difficulty sits.
Consider what a fixed lot does inside a contracting pattern. Each successive swing is shorter than the last, so a stop placed beyond the opposite boundary sits closer each time. The same lot size therefore risks progressively less as the structure matures.
A broadening formation inverts that arithmetic. Each swing is wider than the last, so the stop distance grows on every successive entry. Hold the lot constant and the money at risk grows with it, entry after entry, at exactly the point where the structure is least settled.
The target moves too. In a swing trade inside the pattern the take-profit is the opposite boundary, and that boundary is travelling away from the entry as the structure widens. So the stop distance grows and the distance to target grows with it, which is why a fixed lot does not merely risk more here but risks more in a structure that takes longer to pay.
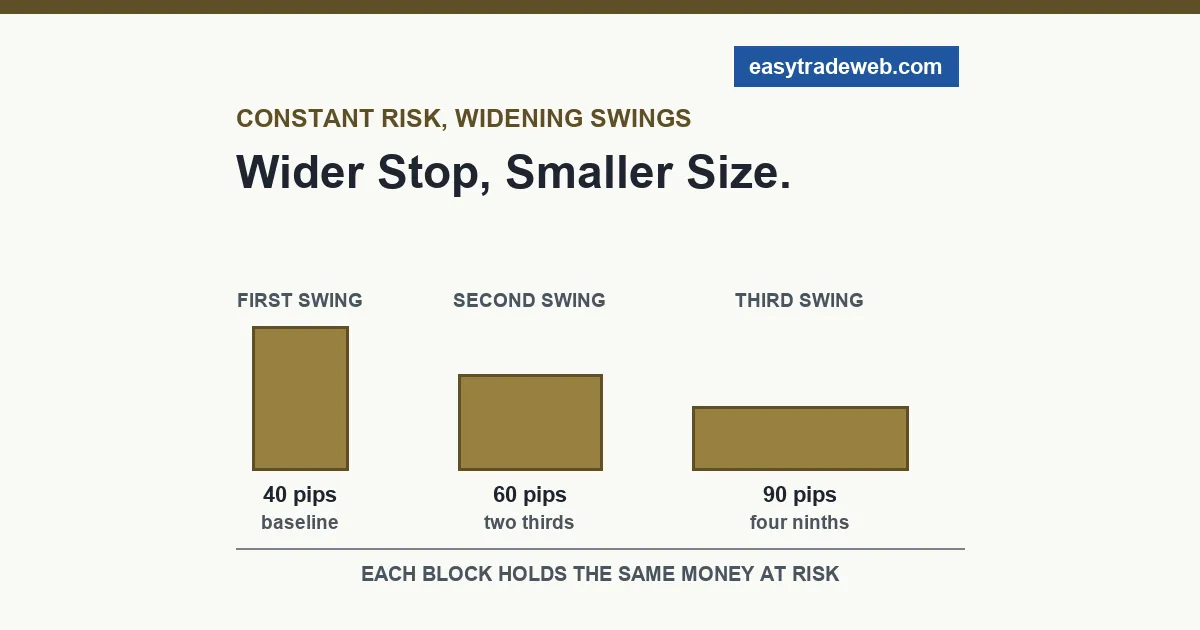
Holding risk constant requires the lot to shrink as the boundaries separate. The table below works one case through: the risk column is held fixed and the size is solved for it, using boundary-to-boundary distances that widen by half on each swing.
| Swing number | Boundary-to-boundary distance | Size that holds risk constant |
|---|---|---|
| First | 40 pips | Baseline size |
| Second | 60 pips | Two thirds of baseline |
| Third | 90 pips | Four ninths of baseline |
The distances above are illustrative, chosen to show the relationship rather than to describe any instrument. The relationship itself is not: size varies inversely with stop distance for a fixed money risk, so a structure defined by widening swings forces the size down as it develops. That is arithmetic on the pattern’s own definition, and it needs no external source to hold.
Telling a Real Megaphone From Four Badly Placed Trendlines
Two diverging lines can be drawn on almost any chart. What separates a broadening formation from a drawing exercise is what the touches are doing, and three faults account for most of the false ones.
The first is touches that do not alternate. If price makes two consecutive highs against the upper boundary without reaching the lower one in between, the alternation the convention requires has not happened. The lines may still contain price, but the structure underneath them is something else.
The second is a boundary drawn through a single extreme. A line that touches its side once is not connecting successive highs or lows, because there is only one. Extending it across the chart gives the appearance of a boundary that the price action never established.
The third is a structure that widens only because the timeframe was changed. Zoom out far enough and almost any sequence contains a wider high and a wider low than the one before. If the shape appears on one timeframe and dissolves on the one below it, what was found was the zoom level rather than the pattern.
A fourth check is worth running before any of these: whether the boundary would have held in real time or only looks that way now. A line that is redrawn each time price passes through it will always appear to contain the move, and that is the same self-confirming problem behind a breakout that fails.
What the Popular Numbers Are and Are Not
Several figures circulate with this pattern, and they arrive on the guides that state them with no source attached. They are worth naming so that a reader recognises what kind of claim each one is.
One guide requires five alternating touches before the structure counts. Another puts the range at five to eight. The same pair of guides state a pullback into the range after a breakout at roughly six times in ten, a profit target of the full height of the pattern, a five percent target rule, and a take-profit set at a fraction of the gap. Each figure appears as a bare number.
None of the five guides names a study, a dataset, a sample size, a market or a period for any of them. No regulator, exchange or published methodology states a success rate, touch count or target rule for this pattern either, which is a different situation from a figure that is merely disputed. There is nothing to check the numbers against.
That makes them drawing conventions rather than measurements. A convention is not worthless: requiring alternating touches before calling a shape a megaphone is a discipline, and it does filter out the loosest drawings. But it describes what a group of chartists agreed to call the pattern, and no count of touches has been shown to change what price does next.
The practical consequence is narrow. Use the touch convention to decide whether you are looking at the structure at all, and do not carry the pullback rate or the target rules into a position size, because there is no measured basis under either. The one thing on this page that does hold arithmetically is the size relationship in the previous section, and it holds because it follows from the definition rather than from a count.
Who Should Leave This Pattern Alone
A trader working a fixed lot on every position should not trade inside this structure. The whole difficulty is that constant size and widening swings are incompatible, and a method with no size adjustment in it has no way to absorb that.
A trader whose account cannot carry the stop distance the third or fourth swing requires is in the same position. The stop has to sit beyond the opposite boundary to be meaningful, and that boundary keeps moving away. An account that can only fund the first swing’s stop is not trading the pattern, it is trading the part of it that fitted.
Anyone who needs a defined invalidation point before entering should also look elsewhere. The structure has no level at which it is definitively over, because a wider high is still consistent with it continuing. Compare that with a diamond pattern, which resolves into a contraction and gives a boundary that stops moving.
Before You Call It a Broadening Formation
Five checks, in order, before the shape earns the name.
- Count the touches and confirm they alternate: high, low, higher high, lower low. Two touches on the same side in sequence disqualifies the drawing.
- Check that each boundary connects at least two extremes on its own side. A line through one point is an extension, not a boundary.
- Drop one timeframe down. If the widening disappears, the structure was the zoom level.
- Decide which of the three constructs you are reading before applying any rule, because the classical megaphone, the wave-counted expanding triangle and the sloped broadening wedge do not share rule sets.
- Work out the size for the widest swing you are prepared to hold, not the first one, and confirm the account can fund that stop distance.
Risk warning: this page is educational and describes how a chart formation is defined and what its geometry implies for position size. It is not advice to trade any pattern or instrument, and nothing here is a signal or a prediction. Leveraged exposure to currency markets carries a high risk of losing money.