
Triangles in Elliott Wave Theory

Not many experts and writers have covered triangles in Elliott waves, and only a handful of articles deal with the topic. You should know that triangles in Elliott Wave theory either contract or expand, a property derived from the angle of the two trendlines that form the triangle itself. You may also want to read about Elliott Wave Corrective Patterns.
If the triangle’s angle points to a common point on the right side of the chart, the triangle is called a contracting triangle. If the two trendlines diverge instead, the triangle is expanding. Outside this wave-counting framework the same diverging shape is read as a broadening formation, under its own set of rules. Both contracting and expanding triangles are corrective in nature, even though each contains five waves. Elliott identified three types of contracting triangles and three types of expanding triangles, which can be broken down as follows:
Types of Triangles in Elliott Wave Theory
Converging lines are read differently outside this framework: pennants and other continuation shapes are classified by the move that ran into them rather than by their place in a wave count.
Specific triangle types form when traders can tell that a triangle is about to form, or is close to completing, based on a series of three rising highs or declining lows created by the market. To do this, there are two possibilities that determine the types of triangles in Elliott Wave theory.
Triangles in Elliott Waves Without a Trend Line
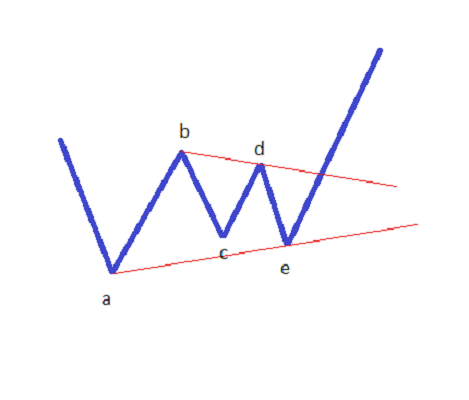
Triangles in this category have a trend line connecting the end of wave a to the end of wave c. This type of triangle is usually complete when wave c is much larger than wave a. When that happens, the a-c trend line actually diverges from the b-d line, so the contracting nature of the triangle is not present.
So the only way to get a contracting triangle here is to draw the a-e trend line. As a general rule, compared with other contracting triangles, this type cannot appear as a b-wave in a zigzag or as a fourth wave in an impulsive move.
The only places we can find triangles like this are complex corrections, and even within these patterns an a-e trend-line triangle cannot form just anywhere. No triangle type can be the first corrective wave in a complex correction either — if a triangle appears, it is more likely to be the last corrective stage of the entire complex correction.
Triangles in Elliott Waves With a Trend Line
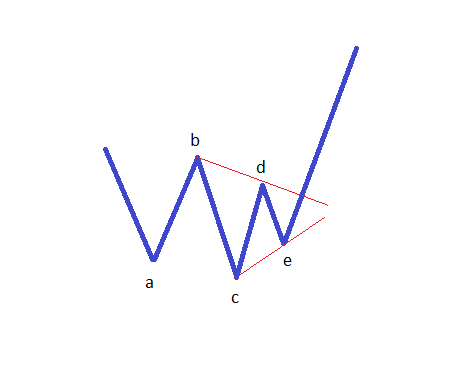
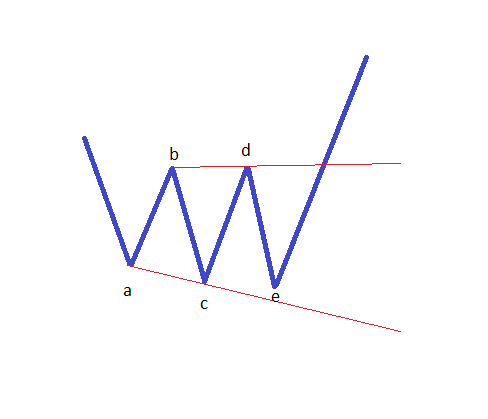
This is another possible way for a triangle to form when the a-c trend line does not show contraction relative to b-d: drawing the c-e trend line instead. This means you need to know exactly where wave c ends, as well as where the corrective wave finishes.
A pattern like this can be deceptive, but remember that every part of the triangle is corrective. This means the pattern can actually end with a triangle of a lower degree, in which case the end point will not be the highest or lowest point of the pattern.
A triangle built with a c-e trend line also makes sense when a-c cannot be constructed in a way that forms a contracting angle with the b-d trend line, and even the a-e trend line does not work. So the only option left is connecting c-e, just as with the previous type of Elliott wave triangle.
This wave also cannot be part of a fourth wave in an impulsive move or a b-wave in a zigzag. The only place it can appear is as part of a complex correction, as one of the x-waves within such a correction, or as the end of the entire corrective move.
The one thing the two triangle types described above have in common is that one segment is much smaller than the rest of the triangle’s segments, which forces the trader to adjust the a-c trend line.
Because of this, triangles like these mostly form during one of the strongest reversal patterns of all: the head-and-shoulders pattern. If you think about how a head-and-shoulders pattern forms and follow the rules for connecting the a-c and c-e trend lines described above, you’ll find that the classic head-and-shoulders pattern, from an Elliott wave triangle perspective, is actually a triangle.
Triangles can also be reversal patterns, even the strong ones. This is living proof that Elliott Wave theory covers all the classic continuation and reversal patterns in technical analysis — for example, head-and-shoulders, as well as flag and pennant patterns, which are in fact still built from contracting triangles.
Three Types of Expanding Triangles in Elliott Wave Theory
By following the expanding triangles to identify the types of Elliott wave triangles the market can form, we can define them and apply the changes in direction. If the contracting triangle — the classic type — has every segment smaller than the one before it, then logically, in an expanding triangle each segment should be larger than the one before it. This is the first type of expanding triangle that Elliott identified.
Horizontal Expanding Triangle
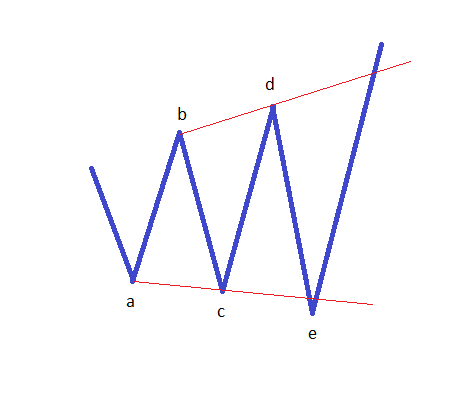
The horizontal expanding triangle extends flat, with each side larger than the one before it, so moves like this are significant and highly volatile, especially when the triangle forms on larger timeframes such as daily and weekly charts and above.
A triangle like this is actually the result of a period of uncertainty in the currency pair. Keep in mind that a currency pair moves based on the differences between the two economies its currencies represent, which means monetary policy between the two jurisdictions can sometimes diverge so sharply that, regardless of what an economic release says, the market has not made up its mind about the next move, and false moves alone will drive the forex pair.
It’s very likely that this kind of trading is what produces a horizontal expanding triangle, which is the rarest of all Elliott wave triangle shapes, since having every wave larger than the one before it isn’t common. So if you think you’ve spotted a triangle like this, you’re probably wrong and the market is actually forming a different pattern. Even so, the triangle rules still need to be respected for this type as well.
Irregular Expanding Triangle

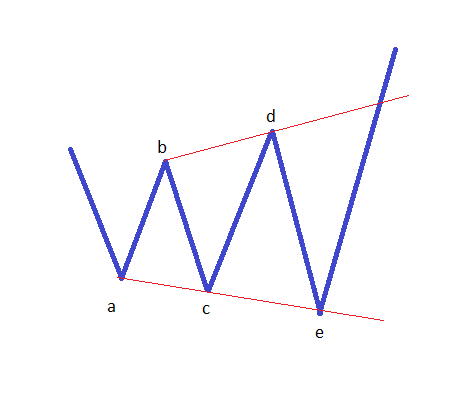
For this triangle to show up correctly, it has to look like an irregular expanding triangle. Here we need to go back to the definition of the irregular contracting triangle, which forms when wave b is larger than every other segment in the triangle.
If that holds for the expanding-triangle pattern, then things must be exactly the opposite in the expanding version. So we define the irregular expanding triangle as one where every side is larger than the one before it, with wave b being the only exception.
This type of triangle occurs more often than the horizontal type, and the expanding nature of the two trend lines is more obvious, because wave b is much smaller than wave a.
Regular Expanding Triangle in Elliott Wave Theory
Comparing this triangle type with the regular contracting triangle, we find it appears more often, and the concept behind its formation is the same. However, the regular expanding triangle will end above or below the end of the previous wave, depending on whether the triangle is bullish or bearish.
Traders often misread this formation feature. Recognizing that a regular expanding triangle can form is a real edge for a trader. To identify a regular expanding triangle, we again start from the regular contracting triangle type and do everything in exactly the opposite way.
Following these steps, a regular expanding triangle is one where wave b is the smallest of the five waves forming the triangle, wave d is smaller than wave c, and wave e is larger than wave d. Building a pattern like this may sound complicated, but it’s actually one of the most common price patterns that form in the forex market.
Regardless of the timeframe, if you build this triangle correctly, you’ll end up with a series of three lows if the triangle is bearish, or three highs if it’s bullish, forming just before the price suddenly reverses. That series is nothing more than a continuing expanding triangle.
In the end, by walking through the types of Elliott wave triangles, we’ve covered every possibility Elliott found for triangular formations. They matter a great deal when counting waves, because they form often.
In fact, most complex corrections the market makes form more often than simple corrections, and they contain at least one triangle among their components.
That triangle can be either contracting or expanding. Regardless of the triangle type, one thing matters above all: paying attention to when the b-d trend line breaks, since that’s when we should look to trade in the opposite direction and place the stop loss at the end of wave e.
This article has laid out every possibility for triangles in Elliott Wave theory. The one constant with triangles is weighing the odds of an expanding or contracting triangle forming, and what to watch for when trading them.
Test this indicator without risking capital
Reading about an indicator is not the same as watching it behave on a live chart. A demo account lets you apply the settings above to real market data and see how the signals form before any money is involved.
Advertising disclosure: partner link. Easy Trade may receive compensation. Educational content, not financial advice. CFDs carry a high risk of losing your capital.
FAQ
What is classical technical analysis?
Technical analysis is a method for estimating the direction of financial market prices by evaluating historical price and volume data where available. The core premise of the technical approach is that market action discounts everything: whatever is known, or can be known, is already “in the price.”
What is wave analysis?
Wave analysis is a type of technical analysis of the market. Under this approach, Elliott waves are the basis of any market fluctuations. Estimating market moves based on wave patterns doesn’t require any indicators, and it’s considered one of the most descriptive types of analysis.
What is the falling wedge pattern?
The falling wedge pattern occurs when an asset’s price moves in an overall uptrend before the price action corrects downward. Within that pullback, two converging trend lines are drawn. The consolidation part ends when price action breaks through the upper trend line, or wedge resistance.
What is the symmetrical triangle pattern?
The symmetrical triangle is a chart pattern marked by converging trend lines connecting a series of sequential highs and lows. These trend lines must converge at roughly equal slopes.
This article is for educational purposes only and does not constitute investment advice. Elliott Wave triangle patterns are a tool for analyzing price structure; they do not guarantee any trading outcome and signals can fail. CFD and forex trading carries a high level of risk and may not be suitable for every investor. Some links on this site may be affiliate links, meaning easytradeweb.com may earn a commission if you open an account through them, at no extra cost to you.