
How To Draw Trend Lines

Drawing a trend line is one of the simplest tools in technical analysis, and traders use it a lot. Even so, some people do not draw it the right way, which leads them to make the wrong decision about their trades. In this article we explain the correct method you should follow when drawing trend lines.
What is a trend line?
A trend line is a line drawn at an angle above or below price. It is used to identify the current direction of price, and it can also be used as support and resistance. Where a line drawn along the highs rises while the line along the lows falls, the pair never converges and the shape they bound is a broadening formation. Tools that draw several lines at once from chosen points, such as the pitchfork, rest on the same judgement about which swing to anchor to.
How to draw a trend line correctly
The chart below shows an example of a trend line in a downtrend and an uptrend.
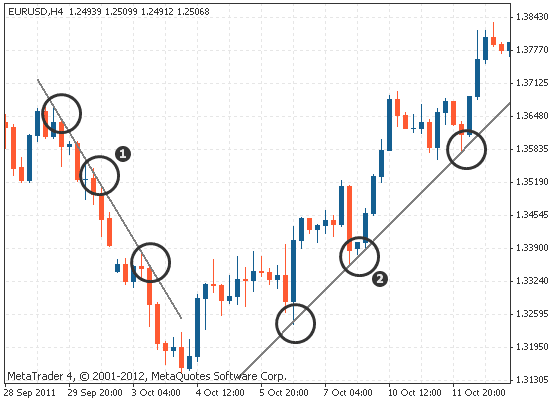
In the figure above, notice that:
- In a downtrend the trend line connects three lower highs.
- In an uptrend the trend line rests on three higher lows.
From the example above we can draw out the rules for drawing a trend line:
1. When you draw trend lines in a downtrend, you draw them above price, along the lower highs.
2. When you draw trend lines in an uptrend, you draw them below price, along the higher lows.
3. A trend line should rest on at least three points. The more points it touches, the more valid the trend line is.
4. A trend line can be drawn on the wicks or the bodies of the candles. Some traders use the candle body, while others use the wicks.
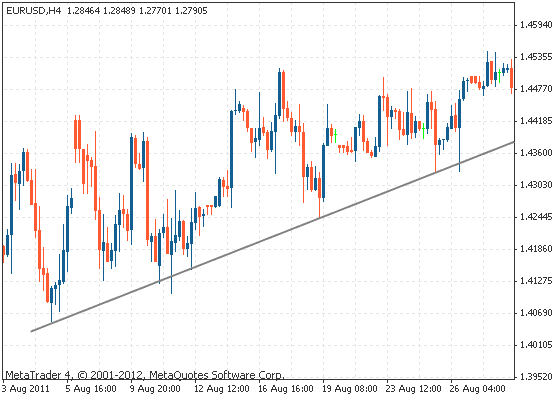
Both methods are correct, but most traders prefer to use the wicks to draw trend lines.
The chart below shows a trend line drawn using the candle wicks.
The next chart below shows a trend line drawn using the candle bodies.
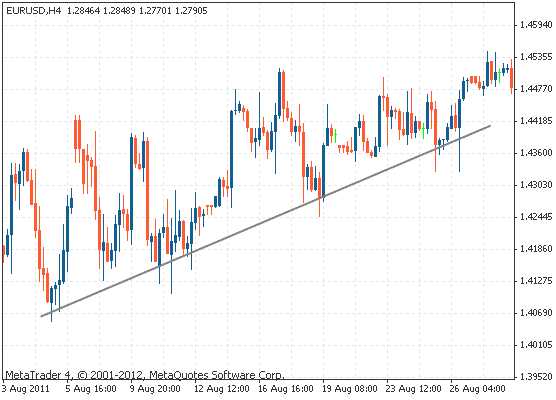
Both methods are correct and you can use either one, but to avoid confusion it is best to stick to one only.
Using the trend line to trade
There are two common ways to trade with trend lines:
- Using the trend line as support and resistance.
- Trading the break of the trend line.
The trend line as support or resistance
If a trend line has been identified and holds as support or resistance, you can use it to enter the market as soon as a signal appears, such as a Japanese candlestick pattern.
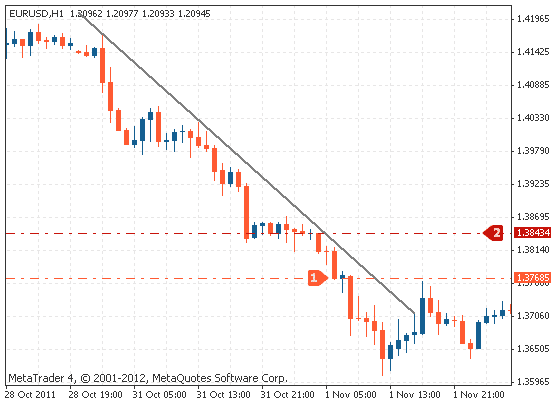
In the figure above, the trend line can be treated as a resistance zone, since price bounced near it more than once. We entered a sell trade at point 1 after a bearish candle appeared, signalling that the downtrend was resuming.
Breaking the trend line
If price breaks the trend line, it is no longer valid for use as support and resistance, and the market direction may change after the trend line is broken.

There are two ways to enter using a trend line break:
- The retest.
After price breaks the trend line, we do not enter right away. Instead we wait for price to retest the trend line again.
- Entering on the break.
With this method you enter directly, without waiting for a retest of the trend line.
The false break
Sometimes a false break of the trend line can happen. Look at the figure below.
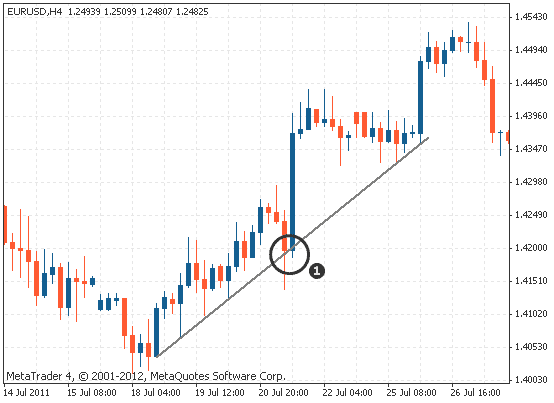
In the chart above, price broke through the trend line to the downside. But it quickly bounced back and closed above the trend line.
At that moment, if you had entered as soon as price broke through, you would have lost the trade.
So it is important not to rush and enter a trade before a candle closes below or above the trend line.
Conclusion
- Trend lines are drawn at an angle and are used to identify the trend and help with trading decisions.
- In an uptrend, trend lines are drawn below price, and in a downtrend they are drawn above price.
- To draw a trend line in an uptrend, the line should rest on two higher lows.
- To draw a trend line in a downtrend, the line should rest on two lower highs.
- A trend line should connect at least three highs or lows.
- The more times price touches the trend line, the stronger it becomes.
- Trend lines can be used as support or resistance, in which case you can enter trades when price touches the trend line.
Frequently asked questions
How do you draw a trend line?
You need at least two highs or two lows to draw a trend line, but for a valid line there should be a third point, or more. The line runs along the candle wicks and does not cut through their bodies. In a downtrend the line is drawn above price, and in an uptrend it is drawn below price.
What is an uptrend?
An uptrend is a trend line where price moves higher. It is made up of a series of highs and lows, and it is rising because there is at least one line connecting two lows that keeps price from falling.
Why is following the trend important?
Trend lines help the trader form a forward view of market movement and identify its direction, as well as support and resistance levels. They are among the most important tools in technical analysis.
What is an uptrend?
An uptrend describes the upward direction, which is the movement of a financial asset’s price when the general direction is up. In an uptrend, each successive high and low is higher than the previous one in the trend. So an uptrend is made up of higher swing lows and higher swing highs.
What are price channels?
A price channel occurs when the price of a security swings between two parallel lines that are either horizontal, ascending, or descending. The channel forms when the price of the security is affected by supply and demand.
Put the theory into practice
Concepts become far easier to understand once you see them on a live chart. A demo account gives you real market data with no capital at risk while you build familiarity.
Advertising disclosure: partner link. Easy Trade may receive compensation. Educational content, not financial advice. CFDs carry a high risk of losing your capital.