
Core PCE Explained: The Gap Between PCE and CPI, Measured

Two official inflation numbers come out of the same American economy each month, and for the same month they can print differently. One is the consumer price index. The other is the price index for personal consumption expenditures, and it is the one written into the Federal Reserve’s own inflation goal.
Most explanations stop at a sentence about weights updating more often. The Bureau of Economic Analysis goes considerably further than that: it publishes a table whose whole purpose is to say, in percentage points, why the two figures parted company. This page reads that table, and then reads what the Federal Open Market Committee actually wrote down.
Key takeaways
- The Bureau of Economic Analysis publishes a reconciliation of the PCE price index against the CPI, in national table 9.1U, and groups the difference into four named causes: a formula effect, a weight effect, a scope effect and other effects.
- The formula is one of those four on its own. The agency states that its index uses the Fisher-Ideal formula while the consumer price index uses a modified Laspeyres formula.
- Scope is a second cause. One index prices what United States residents buy plus what is bought for them by somebody else; the other counts only what a household itself hands over at the till.
- The Federal Open Market Committee pins its 2 percent goal to the year-over-year movement of the personal consumption expenditures price index. The word core is absent from the sentence that sets it.
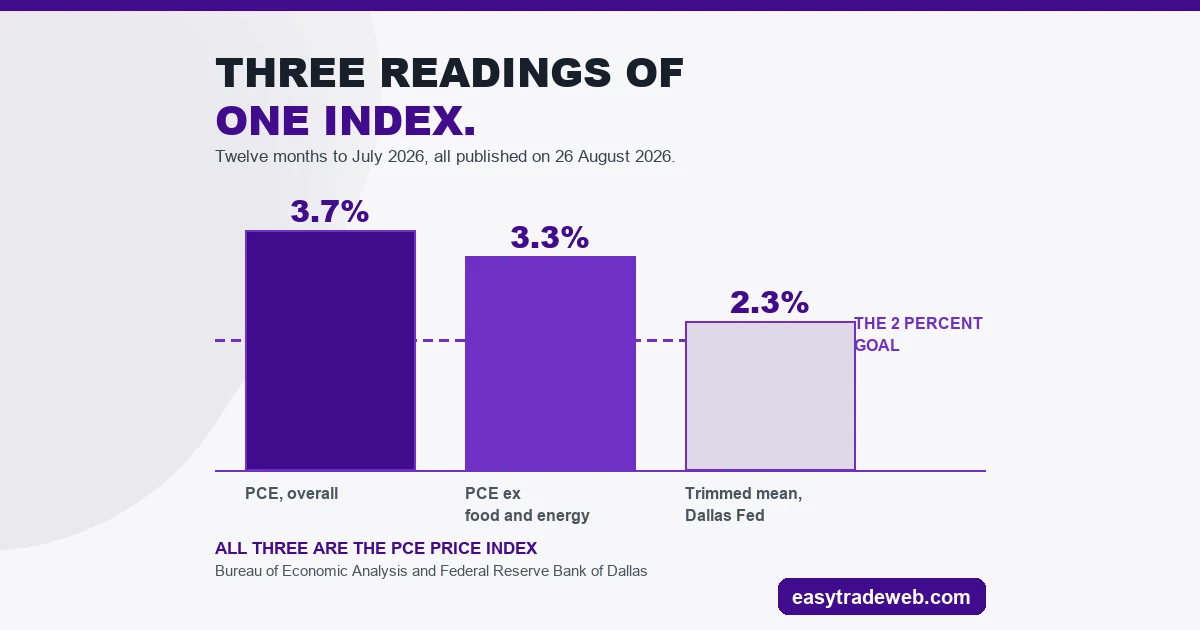
- For the twelve months to July 2026 the agency published 3.7 percent overall and 3.3 percent excluding food and energy, while the Federal Reserve Bank of Dallas published 2.3 percent on its trimmed mean measure of the same index.
Table of contents
- What Core PCE Is, and Which Agency Produces It
- BEA Publishes a Reconciliation Table, and It Names Four Causes
- The Formula Effect: Fisher-Ideal Against Modified Laspeyres
- The Scope Effect: Spending Made On Your Behalf
- The 2% Goal Names the PCE Price Index, Not the Core One
- Trimmed Mean PCE: A Third Core Number From a Different Fed Bank
- Who This Page Is Not For
- Checking a PCE Print Yourself, in Four Steps
What Core PCE Is, and Which Agency Produces It
The PCE price index is produced by the Bureau of Economic Analysis, not by the statistical agency behind the consumer price index. It arrives each month inside a release called Personal Income and Outlays, and quarterly figures for the same index also appear inside the gross domestic product release. The agency dated its most recent monthly release 26 August 2026 and the following one 30 September 2026.
Its own product page describes the index in terms of prices paid by United States residents and, in the same breath, prices paid by anyone purchasing on a resident’s behalf. Hold on to that second half; it turns out to carry a great deal of the difference discussed further down.
Core is not a separate index. It is the same index with food and energy taken out of the calculation, published alongside the full series in the same release. So a reader comparing core PCE with the consumer price index report is comparing two indexes that differ in construction before anything at all has been excluded from either.
BEA Publishes a Reconciliation Table, and It Names Four Causes
This is the part that is almost never passed on to readers. The Bureau of Economic Analysis maintains national table 9.1U for one purpose: to set its own chain-type index beside the all-urban-consumers measure produced by the labour statistics agency, and account for the distance between them.
The reconciliation does not merely say the two differ. It splits the difference into four groups and attributes a share of the gap to each one:
- Formula effect — the two indexes are calculated with different formulas.
- Weight effect — the relative importance given to the underlying commodities is not the same in the two constructions.
- Scope effect — the two indexes are not trying to cover the same spending. The net figure sets what one counts and the other does not against the same comparison running the other way.
- Other effects — seasonal adjustment differences, price differences and a residual.
| What differs | PCE price index (Bureau of Economic Analysis) | Consumer price index (Bureau of Labor Statistics) |
|---|---|---|
| Formula named by BEA | Fisher-Ideal | Modified Laspeyres |
| Spending covered | The personal sector, households plus the nonprofit bodies that serve them, and outlays made for it as well as by it | Only what a household itself pays at the till |
| Where the monthly figure appears | Personal Income and Outlays, with quarterly data in the GDP release | Its own monthly release |
| Named in the FOMC 2 percent goal | Yes, as the annual change in this index | No |
The agency’s own worked illustration is from the third quarter of 2006, and it is worth reading as arithmetic rather than as news. Its index rose 3.0 percent at an annual rate that quarter against 3.7 percent for the consumer price index.
The 0.7 percentage point gap broke down as a weight effect of 0.84, other effects of 0.29 and a formula effect of 0.16, partly offset by a net scope effect of minus 0.50. Within the weight effect, imputed rent on owner-occupied housing supplied 0.56 points and motor fuel a further 0.19.
That example is nearly twenty years old and the current month’s split will look nothing like it. What survives is the structure: four causes, each measurable, one of which can run in the opposite direction to the other three and shrink the gap rather than widen it.
The Formula Effect: Fisher-Ideal Against Modified Laspeyres
Explanations of this subject usually say that one index updates its weights monthly and the other annually, then move on. That is the weight effect. The formula effect is a different line in the same table, and the agency names both formulas explicitly: its own index is built on the Fisher-Ideal formula, while the consumer price index rests on a modified Laspeyres formula.
The practical consequence is that the two indexes answer slightly different questions about substitution. A Laspeyres construction prices a basket held fixed for the period; a Fisher construction pairs neighbouring periods and takes account of both, so consumers moving between products as relative prices change is inside the arithmetic rather than outside it.
None of that is a judgement about which number is correct. Both are correct measurements of what each agency set out to measure. It does mean, though, that a trader who treats one as a proxy for the other is discarding a difference the producing agency itself thinks is large enough to quantify.
The same distinction between construction and coverage runs through the GDP deflator, which is a third measure again, and which that page covers on its own terms.
The Scope Effect: Spending Made On Your Behalf
The scope difference is the one a reader can feel immediately. One index is built from what a household itself pays at the point of sale. The other is built around the personal sector — households together with the nonprofit bodies that serve them — and it counts outlays made for that sector, not only outlays made by it.
Spending made on your behalf is not a technicality. In the agency’s own 2006 illustration the largest single scope item running against the gap was hospital and nursing home services, at minus 0.36 percentage points, precisely because a great deal of what is spent on medical care in the United States is paid by somebody other than the patient at the counter.
So the two indexes can disagree without either being wrong, and they can disagree most when the categories where third parties pay are moving fastest. That is a structural property of the two definitions, not a data problem to be resolved.
The 2% Goal Names the PCE Price Index, Not the Core One
It is widely repeated that the Federal Reserve’s 2 percent target is defined on core PCE. The Committee’s own document does not say that.
Its Statement on Longer-Run Goals and Monetary Policy Strategy — a document adopted with effect from 24 January 2012, and reaffirmed with effect from 27 January 2026 — puts the judgement narrowly. A 2 percent rate, read as the year-over-year movement of the personal consumption expenditures price index, is what the Committee holds to fit its statutory mandates over the long run.
No core qualifier appears anywhere in that sentence. The Federal Reserve’s own public-facing explainer on inflation restates the goal against the same unqualified index.
Core still matters, but it matters as a working tool rather than as the target. Excluding food and energy removes the two categories whose monthly prints swing hardest, which makes the underlying trend easier to read between meetings.
What it does not do is redefine the objective, and the difference shows up whenever the two series separate: for the twelve months to July 2026 the agency published 3.7 percent overall against 3.3 percent excluding food and energy.
For anyone reading policy communications, this is the difference between a number the Committee is formally measured against and a number it finds useful. Both appear in the projections that accompany the dot plot, and both are discussed in the FOMC minutes, which is exactly why they are so easily conflated.
Trimmed Mean PCE: A Third Core Number From a Different Fed Bank
There is more than one way to strip volatility out of this index, and a second official one is published every month. The Federal Reserve Bank of Dallas computes a trimmed mean PCE inflation rate, which it presents as another route to core inflation within the very same index. Its own staff build it from the Bureau of Economic Analysis data, and it lands on the agency’s release calendar rather than a separate one.
Rather than removing food and energy by category, a trimmed mean removes whichever components sit at the extremes in that particular month. The three numbers for the twelve months to July 2026, all published on 26 August 2026, were 3.7 percent overall, 3.3 percent excluding food and energy, and 2.3 percent trimmed mean.
A 1.4 percentage point spread across three official readings of one index is a useful thing to have seen before a headline quotes one of them without saying which.
Who This Page Is Not For
If you are looking for today’s figure, this is the wrong page and any page that prints one is out of date within a month. The numbers here are dated deliberately so that they read as evidence rather than as a current quote. Go to the agency’s own release for the live value, and read this for what the value is made of.
Checking a PCE Print Yourself, in Four Steps
The release calendar is fixed and the documents are public, so none of this requires a data subscription. Before treating a PCE number as comparable to a consumer price index number, run through the following:
- Confirm which series the figure is: the full index, the index excluding food and energy, or a trimmed mean. Three different numbers carry the word core in ordinary use.
- Confirm the period. Monthly annualised, six-month annualised and twelve-month readings of the same index can point in different directions in the same table.
- Check the release date against the agency’s schedule before comparing it with a consumer price index figure, since the two do not land on the same day and one is already public when the other is compiled.
- If the two indexes disagree by more than you expected, look up the reconciliation table rather than guessing which is wrong. It tells you how much of the gap came from formula, weights, scope and everything else.
An economic calendar will give you the date and the consensus. It will not tell you which of the three core numbers the consensus is attached to, and that is the part worth checking yourself.
Risk warning: this page is educational and explains how one official price index is built, published and revised. It is not advice to buy or sell any instrument, it recommends no product, platform or broker, and nothing here is a signal, a performance claim or a prediction. Leveraged trading carries a high risk of losing money rapidly.