
Descending Channel Pattern: Drawing Rules and Trade Costs

A descending channel takes seconds to draw and can be argued about for the rest of the trade. Two traders mark the same falling market, one anchors the lines on the extreme wicks and the other on the closing prices, and their upper boundary ends up in two different places. Every entry, every stop and every judgement about whether the boundary held is then measured from lines that were never defined the same way.
Most pattern explainers describe the shape and move straight to entries. What they leave open is how many points the channel needs, which price the two lines are built from, and whether the distance between them is large enough to pay for the trade. Those three questions decide whether a channel can be traded at all, long before its direction does.
Key takeaways
- A descending channel is two parallel falling lines, and the MetaTrader 5 object that draws one is controlled by three coordinate points: two on the main line and one on the second line.
- MetaQuotes documents that same object as anchored to the highest and lowest closing prices, so the platform default is a channel built on closes rather than on wicks.
- Wick anchoring and close anchoring put the upper boundary in different places on any bar with a long shadow, which changes what counts as a touch and what counts as a break.
- Channel height has to clear the round-turn spread by a margin decided in advance, or a boundary-to-boundary move hands most of itself back in costs.
- A short held inside the channel is a multi-day position on higher timeframes, and MetaQuotes documents that a position carried to the next trading day on OTC markets is subject to swap.
Table of contents
- How Many Points Actually Define the Channel
- Wicks or Closes: One Chart, Two Different Entry Levels
- What the Slope Tells You, and What It Does Not
- Is the Channel Wide Enough to Trade? The Cost Floor
- The Overnight Cost of a Short Held Inside the Channel
- Descending Channel, Falling Wedge and Bear Flag Compared
- Three Situations Where the Pattern Should Be Left Alone
- What Was Checked, and Where
- Questions Readers Ask About Descending Channels
How Many Points Actually Define the Channel
The usual instruction is to connect the highs and connect the lows. That describes two lines without saying how many contacts each one needs, and the answer changes what is on the chart.
The platform is more specific than the pattern literature. MetaQuotes documents the MetaTrader 5 Equidistant Channel as an object with three movable points: a first anchor and a moving point on the main line, and a single point that positions the second line. Two contacts fix the direction of one boundary, and the third fixes the width.
That is a workable minimum for any charting package. Two touches produce a trend line, and drawing trend lines from a pair of extremes is a familiar exercise. A third contact on the opposite side is what turns a trend line and its parallel copy into a channel, because it is the only evidence that the far boundary is doing anything at all.
A descending channel resting on two points is a projection. The upper line has been drawn through two lower highs, the lower line has been offset by an amount nobody has tested, and the first time price reaches that lower line is the first time anyone learns whether it matters. The general treatment of channel shapes sits on our price channel page; what follows here stays with the descending case and the decisions it forces.
Wicks or Closes: One Chart, Two Different Entry Levels
Once the number of points is settled, the second question is which price each point sits on. A bar has a high, a low and a close, and a boundary drawn through highs is not the boundary drawn through closes.
MetaQuotes settles what its own tool does. The MetaTrader 5 Equidistant Channel takes its anchors from closing prices, the highest and the lowest in the stretch being marked, rather than from the extremes of the bars. A trader who selects that object and drags it across a falling market is drawing a close-based channel, whatever the article that recommended the pattern said.
The gap between the two constructions is the length of the wicks at the anchor bars. On a market that spikes and closes back inside, the wick-based upper boundary sits above the close-based one, and price can reach the first without coming near the second. A rule written as a rejection at the upper boundary fires on one chart and never fires on the other.
Neither construction is the correct one. What matters is that the choice is made once, written down, and used for the anchors, the entries and the break test alike. A channel anchored on wicks and then judged broken on closes is two methods sharing one drawing.
What the Slope Tells You, and What It Does Not
Both boundaries falling at a similar rate says something narrow: over the marked window, each swing high has arrived below the last and each swing low has arrived below the last, at a pace steady enough for two parallel lines to contain them.
That is a description of what has happened. It carries no claim about what follows. A channel that has held four times can fail on the fifth, and the lines have no memory beyond the bars they were drawn through. The same limit applies to a shape with only one sloping boundary, such as the ascending triangle pattern, where the flat side carries no forecast either.
The common shortcut is to read the falling slope as a bearish signal and the eventual upside exit as a reversal signal. Both readings add a forecast the shape does not contain. Price leaving a channel to the upside means the last swing high arrived above the line, which is a fact about one bar rather than a change in trend.
Treating the boundaries as levels where a decision is taken, rather than as predictions, keeps the pattern useful. The decision still needs the two tests below before it can be acted on.
Is the Channel Wide Enough to Trade? The Cost Floor
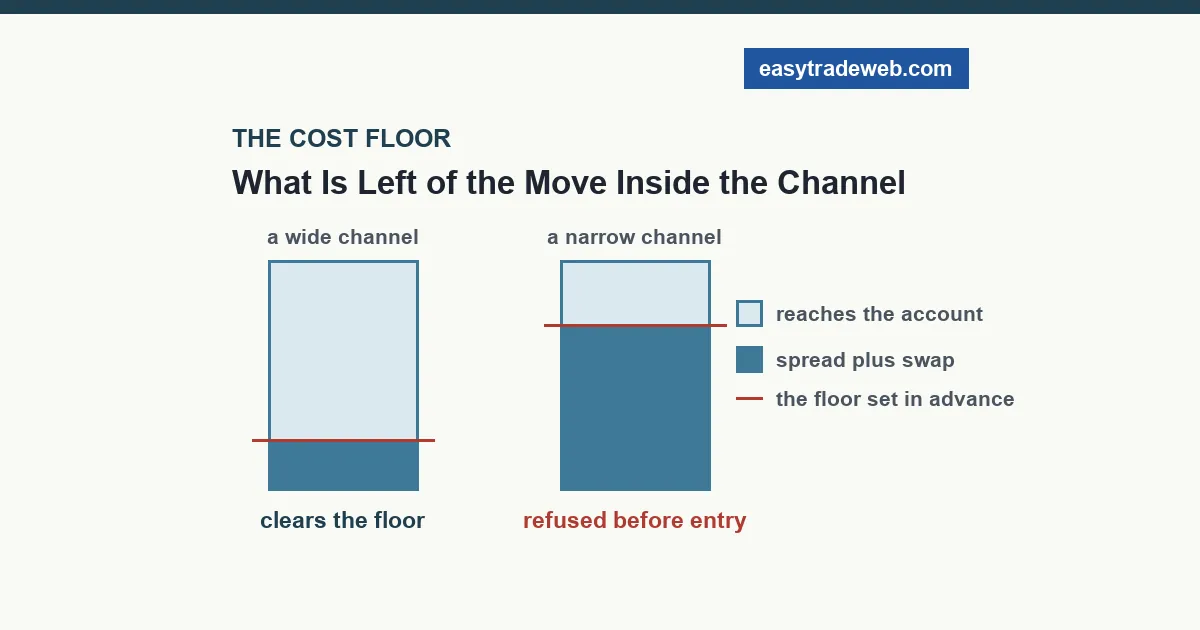
A channel offers a move from one boundary to the other. That distance is measurable in pips at the moment the trade is considered, and it is the only income the setup can produce if it works exactly as intended.
Set that measurement against what a round turn costs on the same instrument. Opening and closing a position pays the spread you pay at least once, and on a variable-spread account the figure at the moment of entry is not the figure in the broker headline. Divide the round-turn cost by the boundary-to-boundary distance and the result is the share of a perfect trade that never reaches the account.
The number that matters is the one chosen before the chart is opened. A trader who decides that costs may take no more than a fixed share of the modelled move has a rule that refuses narrow channels automatically. A trader who measures afterwards will find a reason why this particular channel is the exception.
Two properties push the ratio the wrong way at once. A narrow channel shrinks the numerator of the move, and a low-liquidity instrument widens the cost. A channel that looks tidy on a five-minute chart of an exotic pair can fail this test by a wide margin while still holding its boundaries perfectly.
The test also disposes of the timeframe question without any argument about which chart is better. Whichever timeframe produces a channel that clears the floor is the timeframe that can carry the trade.
The Overnight Cost of a Short Held Inside the Channel
The move from the upper boundary to the lower one takes as long as it takes. On a four-hour or daily chart that is usually several sessions, which makes the position an overnight one whether or not it was planned that way.
MetaQuotes documents the mechanism plainly: on OTC markets such as forex, a position moved to the next trading day is subject to the swap. The pattern is silent on this, because the pattern is a drawing and the charge belongs to the instrument.
The direction of that charge is not fixed. Holding a short can credit the account or debit it depending on the pair and on the rate the broker applies, and the figure sits in the symbol specification inside the platform rather than in any article about chart patterns. It is worth reading before the position is opened rather than after the first night.
Where the swap runs against the position, it belongs in the cost floor from the previous section. Add the nightly charge multiplied by the number of nights the move is expected to need, and test the total against the boundary-to-boundary distance. A channel that passed on spread alone can fail once a five-night hold is priced in.
Descending Channel, Falling Wedge and Bear Flag Compared
Three falling shapes get confused with one another, and the confusion is worth clearing because the drawing rules differ.
| Question | Descending channel | Falling wedge | Bear flag |
|---|---|---|---|
| What do the two boundaries do to each other? | Stay parallel | Converge | Stay parallel |
| Does the width change as it develops? | No, by definition | Yes, it narrows | No, by definition |
| How long is it relative to the move before it? | No fixed relationship | No fixed relationship | Short, following a steep drop |
| What separates it from the other two? | Constant width with no length condition | Shrinking width | Constant width plus a preceding steep move |
Width is the test that does the work. If the distance between the boundaries at the start differs from the distance at the most recent bar, the shape is a wedge and the parallel drawing was forced onto it. Our falling wedge page covers the converging case and the measurement that identifies it.
The flag is separated from the channel by context rather than by geometry. Both are parallel, and the flag additionally requires a steep move immediately before it, which the channel does not.
Three Situations Where the Pattern Should Be Left Alone
The first is a channel with only two anchor points. The far boundary has never been tested, so a plan that expects price to turn there is built on a line that has done nothing yet. Waiting for a contact costs one swing and removes the guess.
The second is a channel that fails the cost floor. This one is arithmetic rather than judgement, and it does not improve with a better entry. A move that hands most of itself to costs is a poor trade whether it works or not.
The third is a boundary being tested while the spread is unusually wide, which on many instruments happens around the daily rollover and in thin sessions. A wick through the line during a temporary widening is not the same event as a break, and the difference between the two is the subject of false breakouts. Checking the current spread before treating a boundary touch as a signal takes one glance at the quote.
What Was Checked, and Where
Two documents were read for this page on 20 August 2026: the MetaTrader 5 help entry for the Equidistant Channel object, for what the object connects and how many points control it, and the MetaTrader 5 help entry on the general concept of trading, for the statement that an OTC position carried to the next trading day is subject to swap. No spread, swap or win-rate figure appears anywhere above, because none was available from an official source.
Questions Readers Ask About Descending Channels
Is a descending channel bullish or bearish?
The shape records a falling market, so the window it covers is bearish by description. That is not a forecast. The channel says each swing high and each swing low inside the marked window arrived below the one before it, at a steady enough pace for two parallel lines to hold them. Whether the next swing continues that sequence is not contained in the drawing, and a channel that has held several times can fail at the next test.
How many touches does a descending channel need?
Three contacts is the practical minimum, and the drawing tool is built the same way. MetaQuotes documents the MetaTrader 5 Equidistant Channel as an object controlled by three points, two on the main line and one on the second line. Two contacts fix the direction of one boundary and the third fixes the width. With only two, the far boundary has never been tested by price.
Should a descending channel be drawn on wicks or on closing prices?
Either is defensible, and the platform default may not be the one assumed. MetaQuotes documents the MetaTrader 5 Equidistant Channel as anchored to the highest and the lowest closing prices, a close-based construction, while most written instructions to connect the highs and the lows describe a wick-based one. Pick one and use the same basis throughout.
What separates a descending channel from a falling wedge?
Width. A channel keeps the same distance between its boundaries because they are parallel, and a wedge narrows because they converge. Measuring the gap at the first anchor and again at the most recent bar settles which one is on the chart. If the later measurement is smaller, the shape is a wedge and forcing parallel lines onto it produces a boundary that price was never respecting.
Does a descending channel always break to the upside?
No. Price can leave through either boundary, and it can also continue inside the lines for a long time without leaving at all. Descriptions that treat the upside exit as the expected outcome are adding an expectation the shape does not carry. An exit through the upper line means one swing high printed above it, which is a single fact about a single bar rather than a completed change of direction.
Risk warning: this page is educational and describes how a chart pattern is drawn and what it costs to hold. It is not advice to open, hold or close any position, and no chart pattern produces a profit. Boundaries are lines drawn through past prices and say nothing about future prices. Leveraged trading carries a high risk of loss.