
Gann Square Of Nine Explained

William Delbert Gann (W.D. Gann) was a remarkable analyst and trader in every sense of the word. Gann developed many indicators and trading methods that are still widely used by traders around the world. More than half a century after his death, his tools are still applied in the markets. This article does not cover those tools; instead it focuses on the foundation Gann built them on, and on his theory: the Square of Nine. See also our guide to Gann Price-Time Angles.
What Is the Square of Nine?
The Square of Nine is a sequence of numbers arranged in a harmonic pattern. The square starts at 1 and turns through a full cycle ending at 9 to form the first square, then runs from 10 to 25 to form the second square, and so on.
The Square of Nine contains two groups of numbers. The first is called the wheel, which runs from 1 to 9 and is laid out in a spiral. It moves clockwise as its values increase and counter-clockwise as they decrease. Each of these numbers represents an angle relative to the centre.
The second group takes the form of diagonals, or levels.
Note: at first you will find it easier to follow this article with the Gannzilla program, which lets you view and work with the Square of Nine.
How the Maths of the Square of Nine Is Built
From the above, the numbers in Gann’s square come in two forms:
- Diagonal (level)
- Circular (spiral)
The Circular Numbers
These numbers are counted by clockwise direction: they increase when moving clockwise and decrease when moving counter-clockwise. Look at the example in the figure below: the grid starts at 26 and increases until it reaches 49, which means it is moving clockwise.
Notice also that the square started at 121 and decreased until it reached 82, which shows it is moving counter-clockwise. Note too that the numbers need a full 360-degree rotation to move from one square to the next.

At the end of every 360-degree cycle you get an odd number in the lower-left part of the square: (3 × 3 = 9, 5 × 5 = 25, 7 × 7 = 49, 9 × 9 = 81, 11 × 11 = 121, 13 × 13 = 169, and so on). This is why Gann’s square is called the Square of Nine: complete one full turn and you land on an odd square, starting from 9.
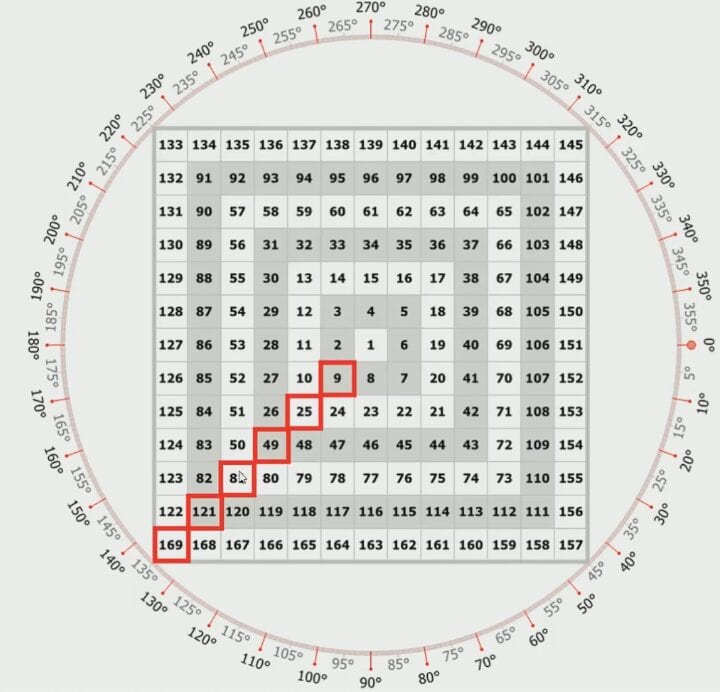
In the upper-right part are the even squares of the numbers: (2 × 2 = 4, 4 × 4 = 16, 6 × 6 = 36, 8 × 8 = 64, 10 × 10 = 100, 12 × 12 = 144, and so on). These numbers are used to highlight possible moves on the chart, as explained below.

You can see how well the Square of Nine numbers align when moving from the odd-number squares to the even-number squares (from the lower-left diagonal to the upper-right diagonal), and from the even-number squares to the odd-number squares. You will notice that the sum of the first and last number of each diagonal, divided by 2, equals the middle of that diagonal.
To make this clearer, take an example in the figure below. When we move from the odd number 25 to the even number 36, adding the two numbers and dividing by two gives the number that corresponds to half the diagonal:
(25 + 36) / 2 = 30.5. Fractions can introduce a small margin of error; in any case we round the fraction to a whole number, which becomes 31. You will notice that 31 sits at the middle of the diagonal, as in the figure:

How to Handle Fractional Numbers
There is a rule that any fraction above 0.5 rounds up to the higher number. Working with fractions takes focus: if you place the fractions in the wrong cells, your calculations will contain an error. One way to avoid fractions is to multiply a price quoted to four decimal places by 10,000. If you use the Gannzilla program, it works with fractions up to four decimal places.
You might ask why we did these calculations. In truth you do not need to do them while trading; the main point is to show how important the numbers in the middle of the grid are, since these numbers can mark a pivot or a possible reversal point on the chart.
When there are large highs and lows in price movement, these numbers can signal that a move may begin at that point.
In general, when analysing the chart you divide the Square of Nine into 8 quarters, each quarter representing a 45-degree rotation. A possible reversal point can be estimated at the end of each of these quarters. Let’s take an example.
If the price is at the odd number 121 on the grid and moves clockwise until it reaches the even number 144 (moving from an odd to an even number), we say the price has moved 4 quarters, i.e. 180 degrees, which equals a full diameter. The following three points act as turning points: 127, 133 and 139, because each of them marks the end of a quarter.

Now take an example moving from an even number to an odd number. If the price is at the even number 64 and moves clockwise until it reaches the odd number 81, you will notice the price has moved four quarters, i.e. 180 degrees. The numbers 68, 72 and 77 form a turning or reversal point for price, since they mark the end of each of those quarters. Don’t worry — we will explain how to apply this on the chart in detail.
The following figure shows what was described above:

The Diagonal Numbers
Now comes the second part of the Square of Nine structure: the diagonal structure. The diagonal structure means focusing on the intersecting numbers, as in the following figure:

The Square of Nine is made up of two types of intersections:
- Vertical-with-horizontal intersections
- Slanted (diagonal) intersections
The vertical-and-horizontal sections are made up of even and odd numbers, while the slanted intersections are made up of odd numbers only. These intersections produce a 90-degree rotation.
You can estimate the size of a price move simply by finding the number the price sits at on the Square of Nine, then rotating until it completes 90 degrees or 45 degrees.
Applications of the Square of Nine
The Square of Nine has several applications. Each one needs its own article to cover fully. Here we will only give a brief overview of some of the applications used, and explain the rest in detail later in a separate article.
Price angles: these are the first application of the Square of Nine. If you have read even a little about time-based analysis, you have certainly come across them. The idea of price angles is that once you identify the angle at which the price is moving, you can estimate the future moves that follow that angle.

Geometric shapes: this is the second application of the Square of Nine. These shapes make it easier to calculate angles. They are:
1- The triangle: one of the geometric shapes used on the Square of Nine. This shape makes it easier to calculate angles, and the Gannzilla program lets you draw it on the square easily.
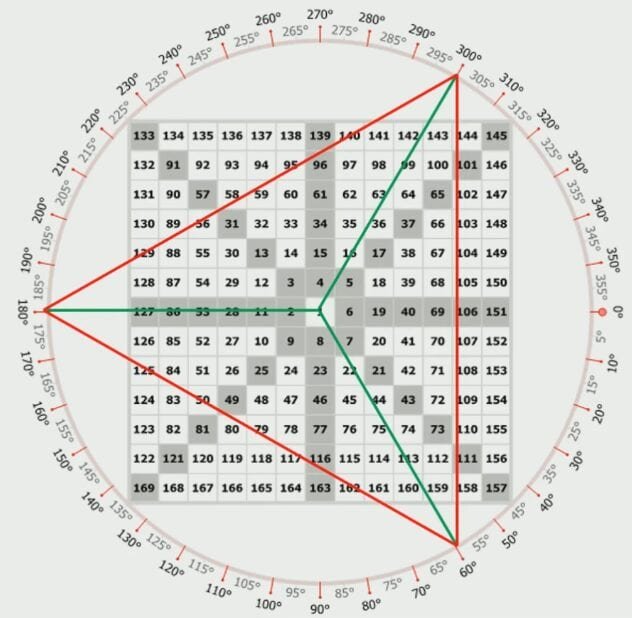
2- The square shape: with this shape you can estimate price moves using any of the numbers on the square. It also makes measuring angles easier.
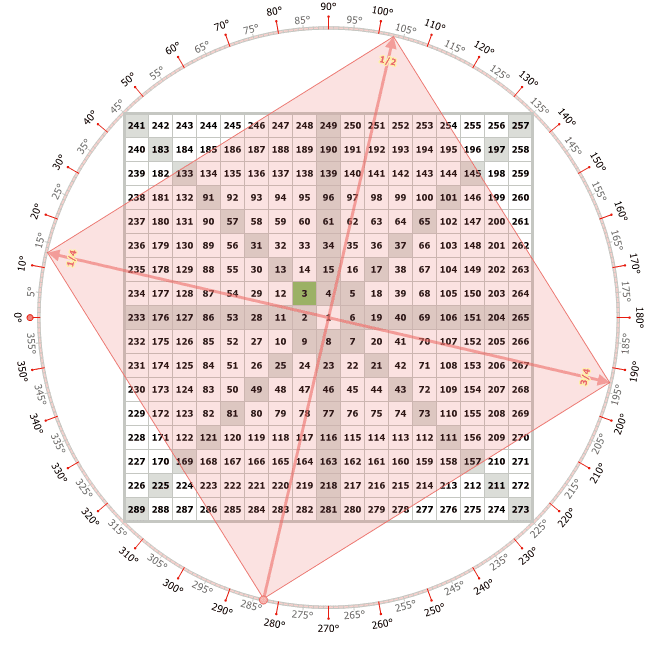
Of course there are other shapes such as the hexagon and the pentagon, but the ones most often used are the triangle and the square.
How to Calculate a Gann Angle for Trading

According to Gann’s theory, price moves in a harmonic way, arranged along a particular angle. You can obtain these angles by identifying the pivot points where a reversal happened near them on the chart, then marking them on the Square of Nine. Sometimes there may be two of these angles. To pin this to a number instead of a guess, derive the levels from any base price.
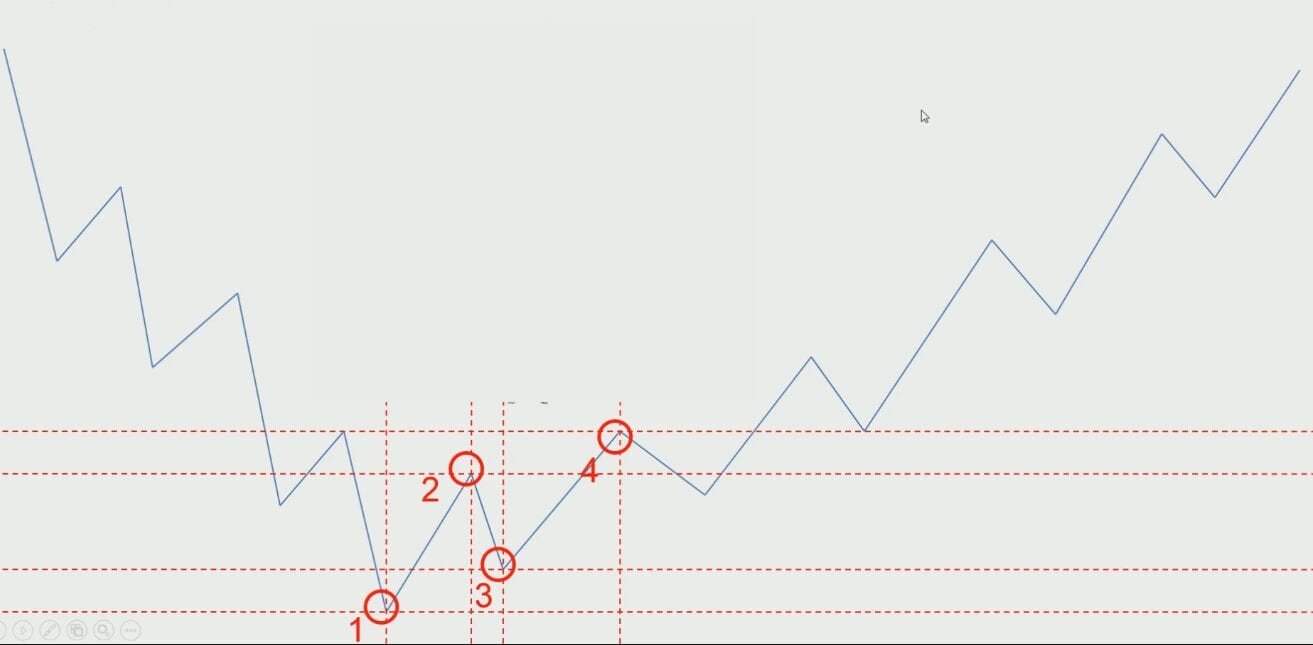
Let’s take an example. Suppose there was a downtrend that then reversed upward. We draw points on the first three or four waves from the start of the trend, as you see in the following figure, where we marked the points 1, 2, 3 and 4.
Now you might ask how to locate those points on the Square of Nine?
It is simple: all you do is take the square root of the price near those points (we will show this in the chart example). Suppose those numbers were 161, 171 and 196.
The next step is to choose a geometric shape to place on the Square of Nine; this shape will pass through three or four points. Look at the following figure:

In the previous figure we have a triangle, and it is known that the angles of a triangle equal 120, so the angle between the price moves is 120.
Keep in mind that you only get reversal points, but there is no way to know whether these are tops or bottoms. Another thing to remember is that with each new rotation the distance between the levels may increase in terms of price and time. And be aware that when the price does not stop at the calculated values, the Square of Nine becomes useless.
Let’s take an example on the chart. Look at the following figure for the GBP/USD pair (British pound against the US dollar).
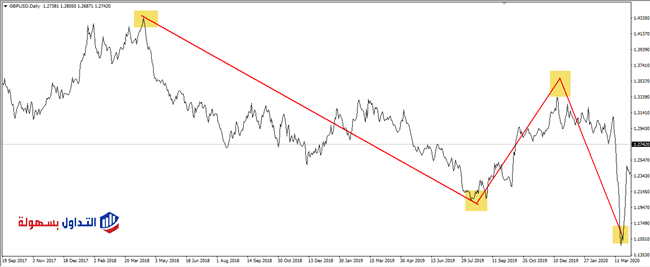
In the previous figure we marked three points on the chart where a reversal happened nearby, and the values of those points were 1.4363, 1.1354 and 1.2040.
First we take the square root of each of the previous numbers, but after removing the decimal point so they become 14363, 11354 and 12040. Taking the square root, these numbers become 379, 368 and 347.
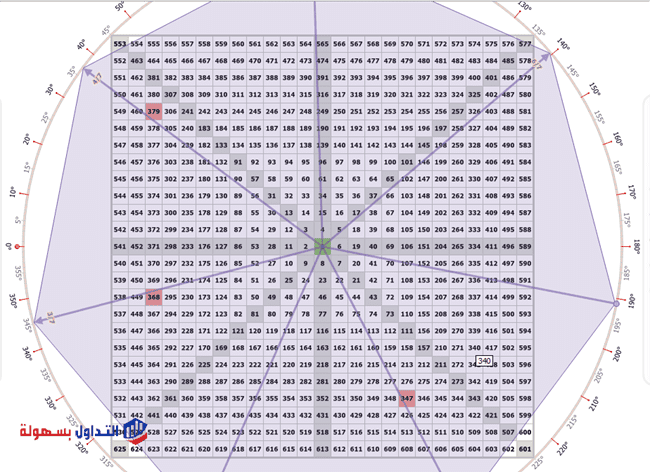
In the previous figure, the geometric shape that matched the points we marked on the Square of Nine was the hexagon, and the angle of a hexagon equals 60 degrees, which means the price moves at a 60-degree angle. You will notice there was a move equal to two angles (as we mentioned at the start), i.e. 120 degrees.
In the previous example you can estimate the reversal point of the next move. All you do is move by 60 degrees according to the direction of the price move: if it is up, it will be clockwise, and if it is down, counter-clockwise. In this example the reversal point was at 365 on the Square of Nine.
Now we want to mark it on the chart. Remember that at the start you took the square root of the price; here we square the number on the Square of Nine, 365, to get 133225. Place a decimal point after the 1 to get the rebound price, which becomes 1.33225. Look at the following figure:

In the previous figure we marked the reversal point at the price 1.33225, and the price did indeed rebound near it.
How to Use the Square of Nine to Time a Reversal
The Square of Nine is sometimes called the magic square because it is used to estimate when a reversal may happen — more precisely, when a price cycle may end — using only the candle count. Yes, you count candles and use them to estimate when a reversal or correction may occur.
But how?
We mentioned above that the diagonal structure of the Square of Nine matters a great deal for price movement. That importance continues in that the numbers on the diagonal intersections express the number of candles in the price cycle.
So if the number of candles in the first cycle is 3, the second cycle will be 13, the third 57, and so on.
How do we apply this on the chart?
Follow these steps:
1- Mark two peaks or two troughs on the chart, on the condition that they are at the start of a trend, as in the following image.
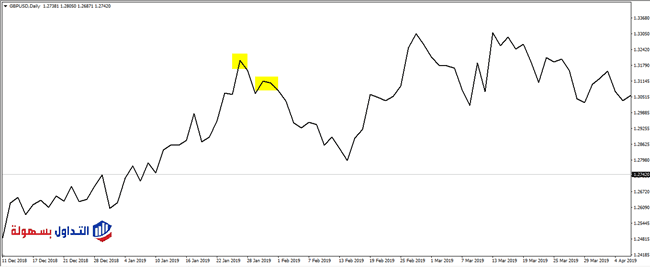
2- Make sure the number of candles between these two peaks or troughs matches a diagonal number from the slanted intersection on the Square of Nine. In the previous example the candle count equalled 3; we look at the Square of Nine to see whether this number is on the slanted intersection or not.
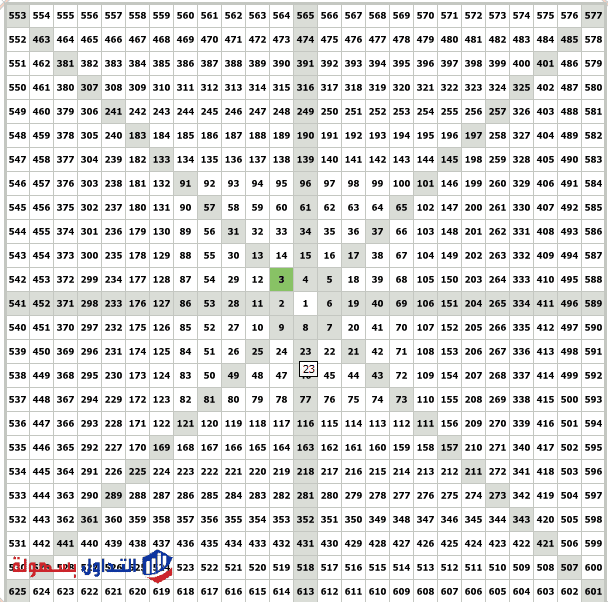
The number is on the slanted intersection. Now the first cycle ended at three candles; we count 13 candles — the number that follows 3 on the Square of Nine — from the start of the cycle, and after it we expect the end of the second cycle, as in the following figure:
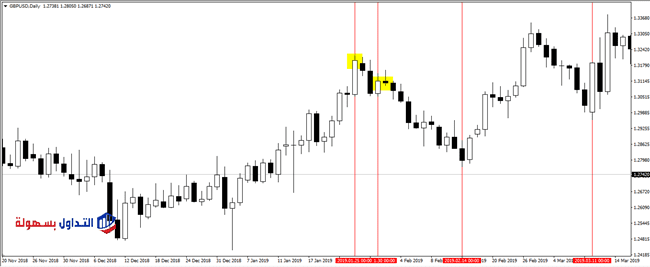
Notice in the previous figure that the cycle ended after 13 candles from its start and a price reversal happened on 14-2-2019, and the third cycle ended after 31 candles on 11-3-2019, as shown on the chart.
By the end of this article you can appreciate how skilled the legendary analyst and trader William Delbert Gann was. He was a remarkable trader by any measure. Even so, there are both supporters and critics of Gann’s methods, and the two sides have endless debates over whether his methods are good or not. But one thing everyone recognises for certain: if Gann had been a fraud, he would not have gained worldwide recognition as one of the best traders of his era, nor would his picture hang in one of the busiest stock exchanges in the world. William was among the few traders who managed to describe the market using a mathematical formula.
Conclusion
- The Square of Nine is a sequence of numbers arranged in a harmonic pattern: the square starts at 1 and turns through a full cycle ending at 9 to form the first square, then runs from 10 to 25 to form the second square, and so on.
- The Square of Nine contains two groups of numbers. The first is called the wheel, which runs from 1 to 9 and is laid out in a spiral; it moves clockwise as its values increase and counter-clockwise as they decrease. Each of these numbers represents an angle relative to the centre. The second group takes the form of diagonals or levels.
- Although the square will not tell you exactly which direction the price will take, it mainly helps you identify the key reversal levels in terms of price and time.
- You may find the Square of Nine hard to understand at first, but over time you will get better at it and it can become a useful tool in your hands. It takes some effort and patience.
Frequently Asked Questions
What are Gann angles?
Gann angles are one of the technical-analysis tools developed by the American trader William Delbert Gann. They can be used to estimate price and time support and resistance levels for price movement.
What is Gann analysis?
William Delbert Gann built a large set of technical-analysis tools that are still widely used today, such as time analysis and numerical analysis, under which fall the Gann grid, Gann angles and others.
What is the Square of Nine?
It is a sequence of numbers arranged in a harmonic pattern, starting from the number one and turning through a full cycle ending at nine, then starting from 10 and turning through a full cycle ending at 25, and so on to infinity.
Read more:
- Time-based analysis in the forex market
- What are time cycles?
- What is the Gann Grid?
Put the theory into practice
Concepts become far easier to understand once you see them on a live chart. A demo account gives you real market data with no capital at risk while you build familiarity.
Advertising disclosure: partner link. Easy Trade may receive compensation. Educational content, not financial advice. CFDs carry a high risk of losing your capital.
Disclaimer: This article is for educational purposes only and is not investment advice. Gann tools, including the Square of Nine, describe possible price and time levels; they do not predict the market, and their signals can and do fail. Trading forex and CFDs on margin carries a high level of risk to your capital and is not suitable for every investor. Do your own research and consider seeking advice from a licensed professional before trading. Some links on this site may be affiliate links, and we may earn a commission at no extra cost to you.