
What Is Gann Grid

Many traders may not know about the Gann Grid tool built into the MetaTrader platform. If you have no idea what it is, you may have missed a lot, or perhaps you have never heard of the tools of the legendary analyst William Delbert Gann (WD Gann), who founded the study of time analysis in the financial markets. For more, read about Gann Square of Nine.
This tool is one of the easiest time-analysis tools available on MetaTrader. In this article we explain it in detail and show how to trade with it.
What is the Gann Grid?
The Gann Grid is one of the time-analysis tools developed by the analyst William Delbert Gann (WD). It appears on the chart as a set of lines slanted at a 45-degree angle, also known as the Gann time wheel. There is also the Gann square (time = price), which is one of the analysis methods and has its own Gann square calculator. To put this on your own numbers, compute the levels at each angle.
The function of the Gann Grid
Each of Gann’s lines points to a long-term direction, whether up or down. When price is above the line, it indicates an uptrend; when price is below the line, it indicates a downtrend.
Points where the Gann lines cross usually signal that changes may occur in the main trend, since the Gann Grid is based on the equilibrium between price and time.
When price falls toward this line during an uptrend, time and price reach their correct balance. A crossing of the Gann lines inside the Gann Grid is a sign that this balance has stopped and that the trend may change.
How to add the Gann Grid to the chart
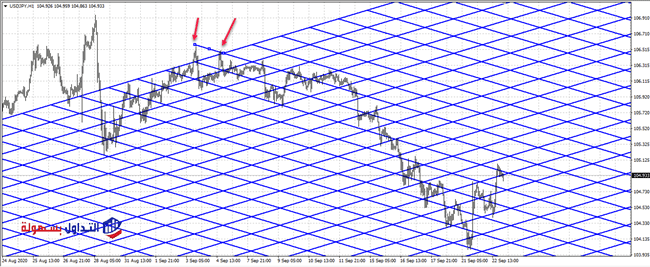
It is convenient that the Gann Grid is already on MetaTrader, so you do not need to download or install it. Just follow the steps shown in the image.
After that, look for two consecutive peaks or two consecutive troughs, then connect them as shown.
How to use the Gann Grid in trading
The Gann Grid has several uses. It can be used to draw support and resistance levels: you add horizontal lines at the Gann Grid crossings, as in the following image.
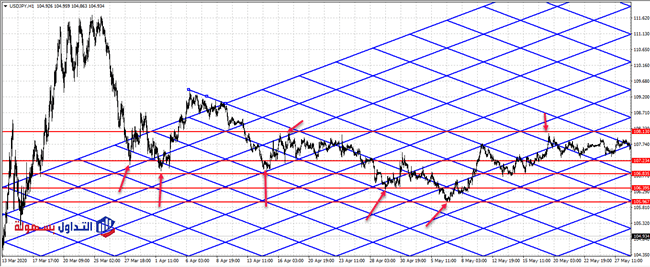
In the previous image you can see how the grid lines up with support and resistance levels; the price reacted at those levels once it touched them.
It can also be used to define time zones on the chart, by drawing horizontal lines at the grid crossings, as in the image, which also shows how to draw the Gann square.
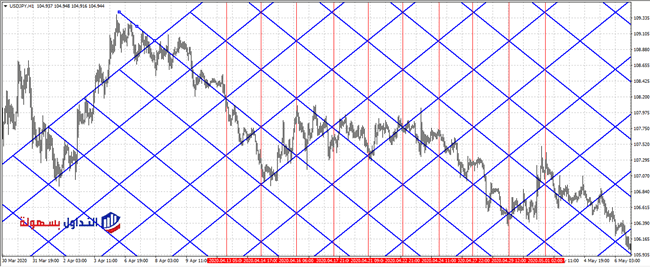
Note the chart after removing the Gann Grid.
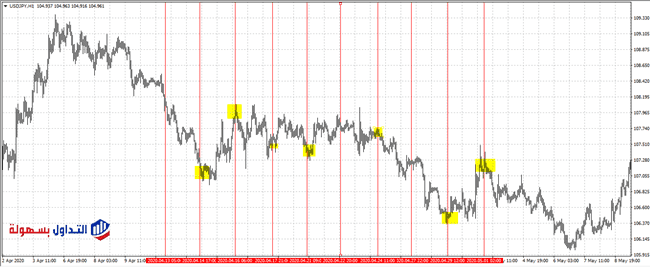
In the previous image you will notice changes in price movement when moving between the time cycles we drew with the Gann Grid, which shows how the grid can be used to map time zones.
It can also be used to gauge the strength of the current trend.
As mentioned above, when price is above the slope line it indicates the current trend is up and strong, and when it is below the line it indicates the trend is down and strong. See the following image.
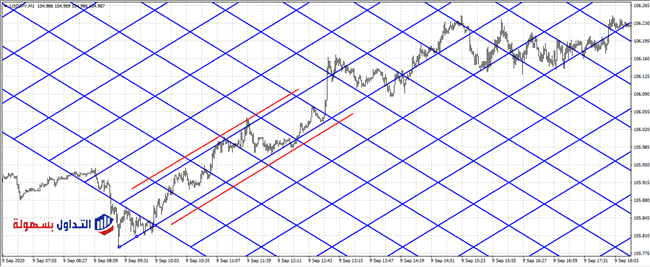
In the previous image the trend was strongly up; you can see this while price moved inside the grid’s channel, but it soon began to weaken and move sideways once it left the channel.
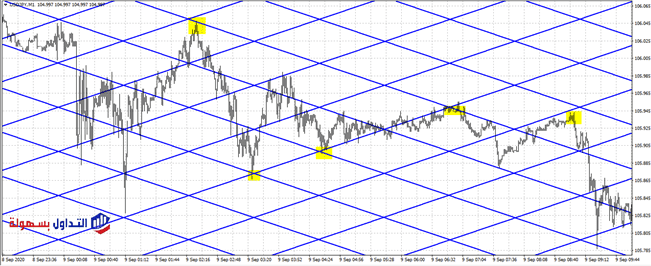
The crossings in the Gann Grid can also be used as stop-loss or take-profit areas. In the following image you will notice that price respects those points.
Conclusion
Although the Gann Grid is one of the strong tools used in time analysis, it is not really enough to use on its own; it should be combined with other tools such as some technical indicators. It is a form of time analysis, not Gann numerical analysis.
Frequently asked questions about the Gann Grid
What is the Gann Grid?
It is one of the time-analysis tools developed by the analyst William Delbert Gann (WD). It appears on the chart as lines slanted at a 45-degree angle.
How accurate is the Gann Grid?
The Gann Grid is an important time-analysis tool, but it is difficult to rely on its accuracy on its own, without other analysis tools.

How do I learn Gann theory?
Gann theory does not suit a beginner trader, because it needs considerable market experience to apply. Learning it means first learning the market, the different trading strategies, and getting exposure to a variety of analysis methods.
How are Gann Grid dates calculated?
Dates are the main factor in Gann theory. Analysts who use it try to forecast future market behavior from historical performance, and the time factor is studied through the market’s price charts.
What are Gann levels?
The Gann square divides price and time into equal sections called time and price levels, drawn on a main axis that is either a high or a low.
How do you make a Gann chart?
It is built on the chart from lows and highs to describe the actual fluctuations of price.
How do you use a Gann chart?
A Gann chart is used to make price charts easier to read by applying an objective calculation, free of subjectivity, to identify the fluctuations on the chart.
How do you use the Gann box?
This is the Gann square, a tool that can be used to measure and reveal recurring price cycles. The box divides price and time into sections called Gann levels.
How do you trade with the Gann Grid?
By recognizing the relationship between price and the market. According to Gann theory, the market is in balance when time and price are in sync.
How accurate is Gann theory?
Although Gann theory is a strong time-analysis tool, it should not be relied on alone, without other analysis tools.
How do you read a Gann chart?
To read a Gann chart, the trader should study the behavior of time and price, and keep learning to understand their role in trading.
How do you use Gann and Fibonacci tools?
These tools can help identify reversal areas after a correction, or the expected end of a stock’s extension at the close of a trend.
How do you calculate a Gann cycle?
Gann held that prices move through a set of cycles, like everything in the universe, meaning the direction of price movement changes when it enters a new cycle.
How do you draw the Gann square?
Start at the main pivot point and draw it so the 1X1 line follows the current market support areas.
How accurate is the Gann cycle?
It is one of the basic analysis tools, but you should rely on more than one analysis tool for a price-movement forecast to be effective.
What is the Gann formula?
Gann theory is about correctly identifying what are called equilibrium points, the points that are used to anticipate future prices and price movement.
How do you use Gann lines?
These are the lines that form the Gann fan, which consists of 9 diverging lines designed to show support and resistance areas.
Put the theory into practice
Concepts become far easier to understand once you see them on a live chart. A demo account gives you real market data with no capital at risk while you build familiarity.
Advertising disclosure: partner link. Easy Trade may receive compensation. Educational content, not financial advice. CFDs carry a high risk of losing your capital.