
What Is Gann Fan

Have you ever wondered whether the geometric angles of the Gann Fan can help you read a chart and make trading decisions? The idea is not new. Traders have used it for more than half a century, going back to the analyst and trader William Delbert Gann. Gann’s method relied on a number of tools built on geometric angles. Two of the most widely used are the Gann Grid and the Gann Fan. This article looks at the second one, the Gann Fan, in some detail. For more, read about Gann Square of Nine.
What is the Gann Fan?
It belongs to a family of tools that turn a chosen point on the chart into a set of lines, alongside Andrews Pitchfork, which builds its lines from three anchors instead of one.
The Gann Fan is one of the more interesting trading tools. It is made up of a set of lines and angles. It is one application of geometric angles, built on the idea that the market moves according to a geometric shape and rule.
Understanding the Gann Fan
Based on Gann’s theory, the market moves according to a geometric pattern. The Gann Fan uses a set of angles, but it is centred mainly on the 45-degree angle. Above that come four angles, and four more below it.
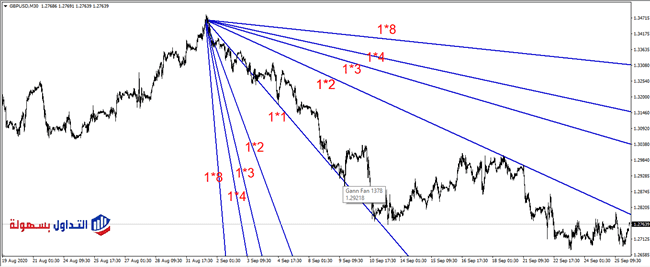
Each line represents one of the angles used in the Gann Fan. All of these lines start from a single point, and together they form a shape that looks like a Chinese hand fan, which is where the name comes from.
The 1/1 line represents the 45-degree angle, or the central angle. The 1/2 line represents an angle of 26.5°, which is the one directly after the 45-degree angle. It is followed by the 1/3 line, which represents an angle of 18.75°, then the 1/4 line, then the 1/8 line, which represents an angle of 7.1°. These angles form above the central angle.
The Gann Fan is also made up of the angles on the opposite side, below the 45-degree angle. These include the 1/2, 1/3, 1/4 and 1/8 lines, which represent angles of 65.75°, 71.25°, 75° and 82.5°.
See the figure below.
How to plot the Gann Fan on charts
The good news is that the Gann Fan is built into most trading platforms, so you do not need to download or install it. In MetaTrader, for example, all you have to do is follow the steps shown in the image below.
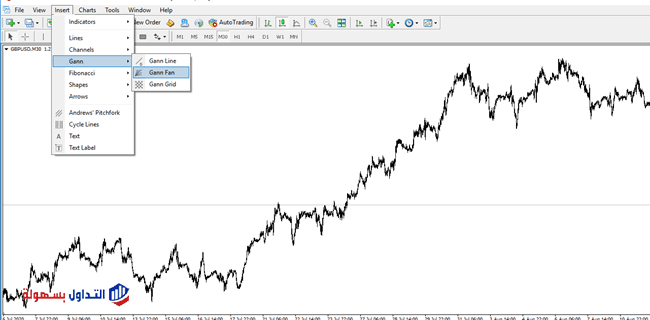
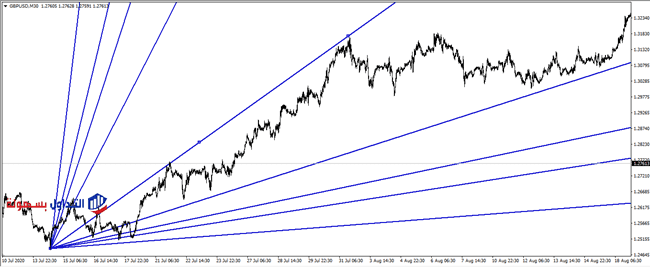
After that, you click on the highest or lowest point at the start of the trend. In the previous figure the trend was rising, so we click on the lowest point and drag up to the highest peak of the trend, as shown in the figure below.
Using the Gann Fan
The Gann Fan is used mainly to identify the direction of price movement, and also as support and resistance levels, to gauge possible future price moves. For example, in an uptrend, if the price stays above a rising angle within the empty area without breaking any of the angles downward, the trend is still considered bullish, as shown in the figure. If you want to check it numerically, work the angular levels out numerically.

In the previous figure you will notice that the price started to rise again as soon as it approached the 1/2 angle, which confirms that this level acts as a good support level and that the trend is still up.
Likewise, if the price stays below a falling angle during a downtrend without breaking above it, the market is considered bearish.

Sometimes an uptrend can reverse and break below a rising angle. In that case the price level is likely to move to the next angle below it. Similarly, if a downward-moving price reverses and breaks through a falling angle, the price level is likely to rise to the nearest angle above it.
The trend is strongest when it moves in the middle around the 45-degree angle. A bullish market is signalled when prices are held within a range between two angles above the ideal, or 45-degree, angle, while bearish markets are held between angles below 45 degrees.
How to trade using the Gann Fan
There are several ways to trade with the Gann Fan. Among the best known are breakout trading and pullback trading.
Breakout trading
In breakout trading, when a break is spotted through one of the nine lines, you enter a trade in the direction of the break. Of course, you should not open a trade the moment the break happens or on the first candle that closes past the Gann Fan line. To make trades smarter, wait for a second confirmation candle that pushes beyond the initial breakout candle.
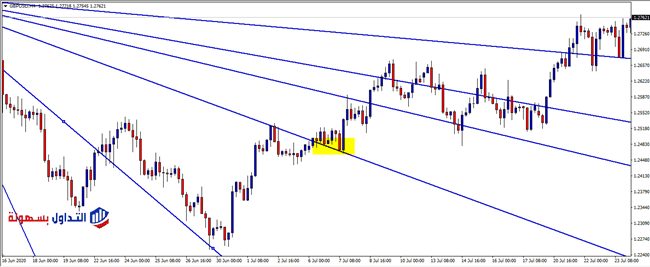
According to the theory, the stop loss should be placed below or above a previous low or high on the chart. In the previous example, the stop-loss order would be placed at the lowest low.
Pullback trading
Pullback trading can be used when a reversal candle appears near the Gann lines. Do not rush, though; wait for another confirmation candle to appear. The stop loss should be placed below or above the most recent high or low formed at the time of the pullback.
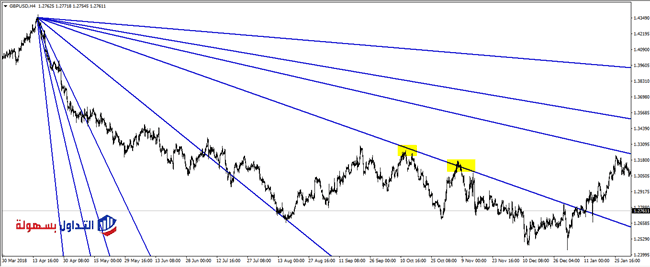
The angles in the Gann Fan work well as support or resistance levels, but on the larger time frames, which makes them well suited to long-term and medium-term trading.
Conclusion
- The Gann Fan is one of the more interesting trading tools. It is made up of a set of lines and angles, is one application of geometric angles, and is built on the idea that the market moves according to a geometric shape and rule.
- Each line represents one of the angles used in the Gann Fan. All of these lines start from a single point, and together they form a shape that looks like a Chinese hand fan, which is where the name comes from.
- The Gann Fan is used mainly to identify the direction of price movement and as support and resistance levels, to gauge possible future price moves.
Read also:
What is time analysis? A guide to learning time analysis in forex
Time analysis: what are time cycles?
Time analysis: what is the Gann Grid?
Put the theory into practice
Concepts become far easier to understand once you see them on a live chart. A demo account gives you real market data with no capital at risk while you build familiarity.
Advertising disclosure: partner link. Easy Trade may receive compensation. Educational content, not financial advice. CFDs carry a high risk of losing your capital.