
Gann Price Time Angles

In 1908, William Gann introduced a theory for describing time analysis and price angles through price movements in the financial markets. He built it on the idea that price moves in defined time cycles, just like anything else in the universe. The weather, for example, passes through four seasons: autumn, spring, and so on. For more, read about Gann Square of Nine.
Gann was the first person to describe prices using a mathematical formula, and he succeeded in creating what is known as the Square of Nine, from which he derived several applications within his theory. In this article we look in some detail at one of the most widely used of those applications, the price-time angles. We cover what they are and how to trade with them based on geometric shapes, along with an explanation of an indicator that simplifies the process of drawing and identifying the angles on the chart. In practice, compute the levels at fixed angular steps.
What are Gann price-time angles?
This is a method for showing the relationship between price and time in order to estimate possible upcoming moves, by identifying support and resistance zones. The core idea behind using price-time angles is that price moves within a defined range, and those ranges can be measured through geometric angles. Once you identify the first angles, you can estimate where and when the following angles may form.
The core idea behind price-time angles
The core idea of price-time angles was derived from the Square of Nine that Gann developed. The Square of Nine is built on the numbers 1, 2, 3, 4, 5, 6, 7, 8, 9, which rotate clockwise starting from 1 up to 9 to complete a 360-degree rotation. The square then begins a new cycle starting at 10 and running up to 25. Look at the following figure of the Square of Nine.
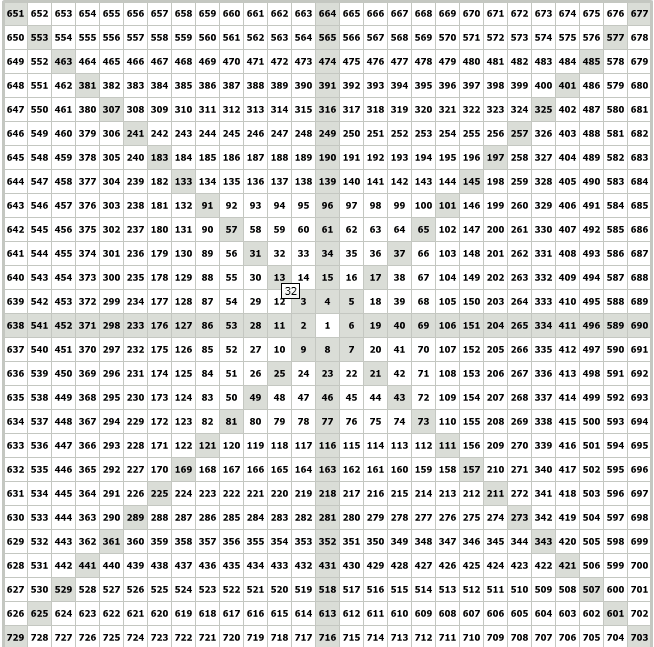
You will notice in the figure above that the Square of Nine is made up of successive cycles, where each cycle represents a 360-degree angle.
Once you identify the angle from which price reversed, you can work out the upcoming angles that price may reach and reverse from. Suppose price was moving in a square shape, meaning it moves in a 90-degree angle, and it reversed at the number 431 on the Square of Nine while moving upward, that is, clockwise. From the figure above you can estimate the next reversal price by rotating 90 degrees from the first reversal point, that is, at the number 452, where a reversal may occur or where price may reach that level.
Let us apply this to the chart. But before taking an example, we need to know how to obtain the numbers on the Square of Nine from the price.
It is very simple. All you need to do is take the square root of the price without the decimal point that sits between the digits. For example, if we want to know what the GBP/USD price of 1.59727 equals on the Square of Nine:
First we remove the decimal point so the number becomes 159727. Then we take the square root of this number with a calculator, which gives us 399.6586. We round the number to a whole number without decimals, so it becomes 399.
This means that the price 1.59727 corresponds to the number 399 on the Square of Nine.
Now let us take an example. Look at the following figure:

In the figure above, price reversed at 1.45967 while the trend was down, that is, counterclockwise, and we want to work out the next angle or the next reversal. First we take the square root of the price to get the number on the Square of Nine, which becomes 382. Then we rotate counterclockwise. Let us try, for example, a 45-degree angle (we will cover how to determine the angle later), which gives the number 372.
Now we square the number to return it to its original form, giving 13834. We add back the decimal point that was after the first digit so it becomes 1.3834. You will notice it is the same price near which the reversal occurred.
Of course the calculation is not done this way in practice, but this is the core idea on which price-time angles are built. Do not worry, it will become clearer shortly.
How is the value price will reach calculated based on the reversal angle?
The value price is expected to reach is calculated using the following mathematical equation:
Price value at a given angle = (square root of the price + or − the angle coefficient), with the whole bracket squared.
Where the angle coefficient = the angle value divided by 180.
If price is in an uptrend the calculation uses addition, and if it is in a downtrend the calculation uses subtraction.
Let us apply this to the following example:
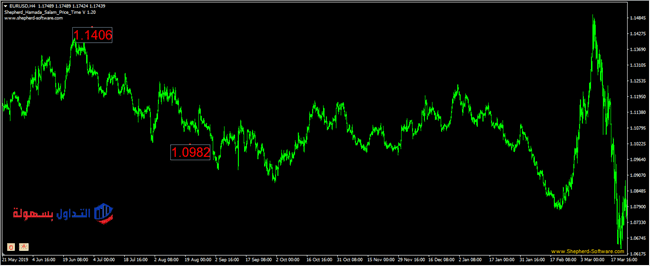
In the example above, price was at a top of 1.1406, and we need to know the price the market will reach after a full 360-degree rotation.
First we take the square root of the price after removing the decimal point, which becomes 106.79. Then we calculate the angle coefficient by dividing 360 by 180, giving 2.
Next we subtract the angle coefficient from the square root of the price and square the result, which becomes 10982. We add a decimal point after the first digit to return the price to its original form, giving 1.0982. You will notice it is the same price the market reached, as shown on the chart.
Of course we will not use this method, as it is complicated and requires a lot of calculation. We will use Mr. Hamada Salam’s indicator, which works on the same equation we explained above. This indicator is genuinely fine work and deserves thanks and appreciation for Mr. Hamada Salam and everyone who worked on it. It is also worth mentioning that Mr. Abu Hamza developed a version of it, in addition to a version developed by the Shepherd company. The version we will use today is the one developed by Shepherd.
You add the indicator to the indicators folder in the MetaTrader platform, then attach it to the chart as shown in the following figure:

After that it will appear as in the image.
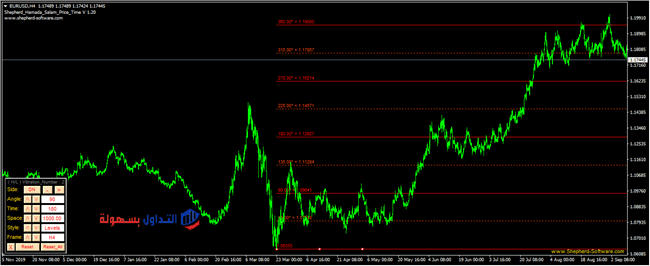
You will notice a small window has appeared at the bottom left of the screen, as in the following figure:
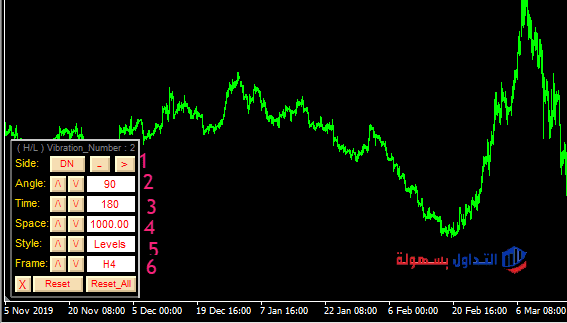
Follow the numbers on the image to learn the indicator settings.
1- In this option you can change the direction in which the angles are drawn, where UP means upward and DN means downward.
2- In this option you can control the size of the reversal angle.
3- In this option you can control the size of the time interval (the number of candles inside each time cycle).
4- This option sets the offset of the lines. The offset differs from one time frame to another: it equals 1000000 on the small time frames from one minute up to the half hour, equals 10000 on the one-hour time frame, and equals 1000 on the large frames from four hours and the daily, weekly, and monthly.
5- It provides several different tools, namely the angle line levels, the developed fan, and the star shape, in addition to the time channel that we will use today.
6- The time frame in use.
Now that you understand the basis on which price-time angles are built and you know the indicator that makes the process easier, let us go deeper and study the geometric shapes, which are among the best applications used in price-time angles.
The geometric shapes
The geometric shapes are one of the applications of price-time angles. Through these shapes you can estimate the price the market is expected to reach by knowing the reversal angle, since each shape has its own reversal angle, and each shape has distinct characteristics that set it apart from the others.
There are a large number of these shapes. In this article we will cover the most common and most frequently used in trading.
Read also: The relationship between Elliott waves and time analysis.
Time analysis: the circular shape
The first shape is the circular shape. It is characterized by strong moves and is often found in long-term trends. The first reversal angle within this shape is 360 degrees, meaning price moves a full cycle without any corrections during those moves.
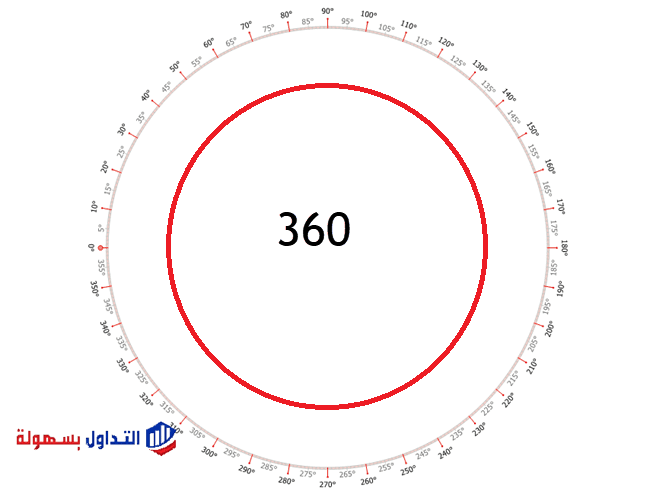
In this shape price starts from the zero angle and moves directly to the 360 angle without any reversal at the angles below 360 degrees. Note the following figure:
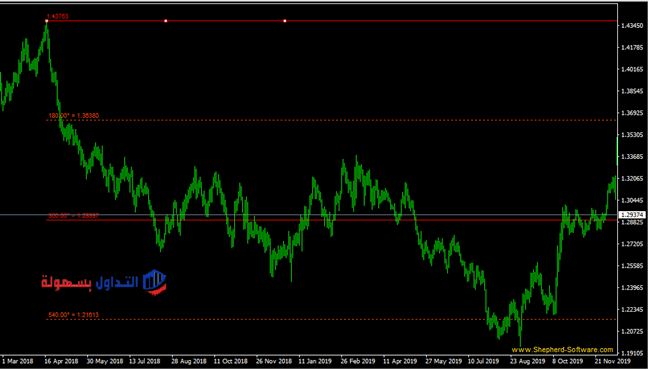
In the figure above we drew the price-time angles indicator from the top, and the first reversal angle was 360 degrees, without any reversal at any angle below 360. This is one of the cases that form the circular shape, moving from zero to 360 directly.
There is another case for the shape, where it forms over two stages: the first is a reversal to the 270 angle, reaching any of the following angles, the 180 angle, the 135 angle, or the 90 angle, and it rarely reaches the 45 angle.
Note the following figure:

Note in the figure above that we drew the indicator from a bottom, and price reversed at the 270 angle, then fell to the 180 angle and rose directly to the 360 angle.
It is clear from the previous examples that the reversal angle in the first case is 360 degrees with no sub-angle, and the reversal angle in the second case is the 270 angle, with three sub-angles at any of which the trend may resume, namely the 180 angle, the 135 angle, and the 90 angle, and it may reach the 45 angle.
Keep in mind that price breaking the zero angle (the bottom from which the angles indicator was drawn) means the shape has failed.
How is this shape traded?
In the first case we cannot trade this shape because the reversal angle is 360, and it is not possible to assume price will reach it. In the second case, buy or sell trades are placed according to the trend at the reversal and the close of two candles above any of the sub-angles.
Price angles: the straight shape
In this shape the circle is divided into two halves, where the reversal angle in this shape is half the reversal angle of the circular shape, that is, it equals 180 degrees, then it reverses again from the 360 angle. This shape is characterized by strong momentum in the direction of the price move, but less than the circular shape.
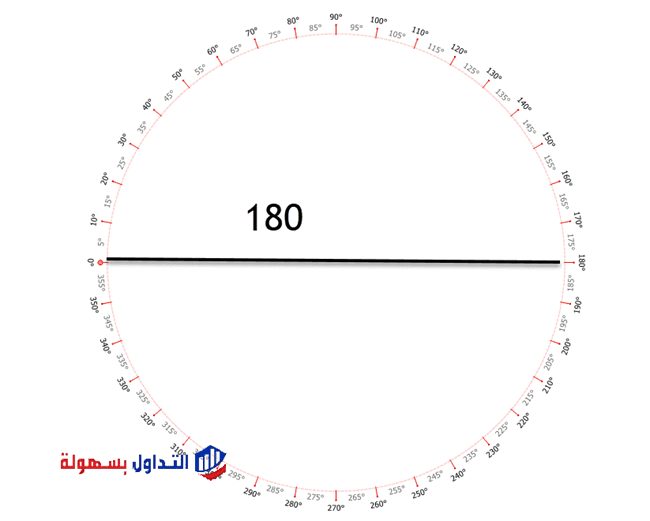
The sub-angle for this shape is the 90 angle and the 45 angle, then the trend resumes and reaches the 360 angle. Note the following figure:

In the figure above you will notice that we drew the price-time angles indicator from the top, and the pair reversed at the 180 angle, then rose again to the 90 angle, from which the downtrend resumed and reached the 360 angle.
In the figure above you will notice that price pivoted around the 180 angle. For this reason it is always advised not to enter trades until you confirm the angle has broken and price has closed below it by two candles. Had we rushed to enter as soon as price reached the 180 angle, we might have lost many pips, or lost the trade entirely.
Price angles: the triangle shape
This shape is called the triangular shape because the 360-degree angles of the circle are divided by three, making its reversal angle 120. Two angles can be used to make 240 the second main angle, and the second angle is added to make 360 the third main reversal, at which point price has completed a full cycle.
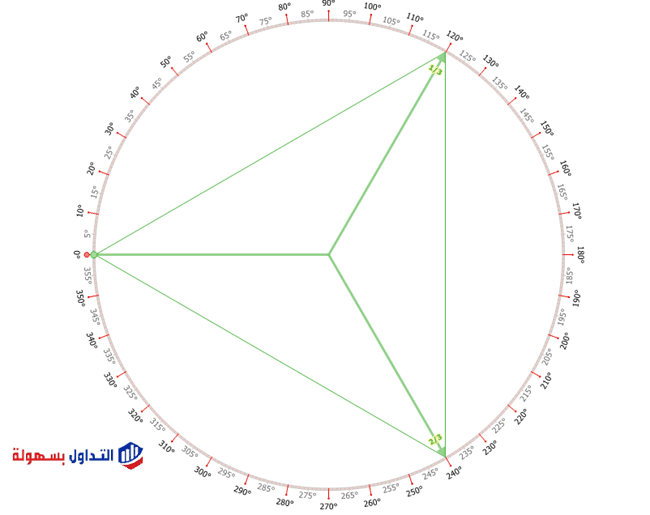

From the above it is clear that the main angles of the triangle shape are 120, 240, and 360, and the sub-angle is the 60 angle, from which it reaches the 360 angle. Note the following figure:

In the figure above you will notice that we drew the price-time angles indicator from a top, and price reversed at the 120 angle and reached the 60 angle from it, then resumed its downtrend and reached the second main angle at 240, then the 360 angle to complete a full cycle.
When trading this shape we place the take-profit order at the next angle, because price sometimes does not complete the shape. We want to avoid that, and we can re-enter after confirming the level of this angle has broken and price has closed below it by two candles.
Price angles: the quadrilateral shape
The quadrilateral shape is one of the shapes that recur frequently on the chart. In it the circle angle is divided by 4, making the first reversal angle 90, from which it reverses to the sub-angle 45, then moves toward the second main angle 180, then moves to the 270 angle, then moves again to the 360 angle.
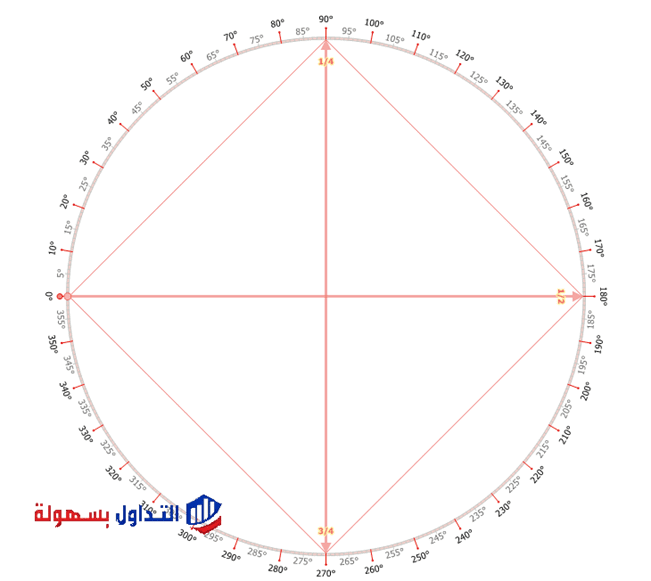
It is not a requirement that a reversal occurs from the second, third, and fourth main angles; it may or may not happen. Note the following figure:
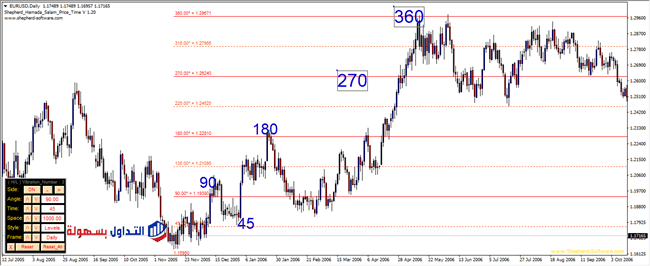
In the figure above price was moving in a quadrilateral shape. Price started from the 90 angle, then corrected from it to the 45 angle, then rose to the 180 angle, then corrected and rose to the 270 angle but did not correct near it as we mentioned above, then rose and completed the cycle to the 360 angle.
I think you now understand the core idea of trading using price-time angles. You can apply it to all shapes, not only the shapes we explained, as there are 12 shapes. Of course we cannot gather them all in one article, so we will mention for each the main angles and the sub-angles.
Price angles: the pentagon shape
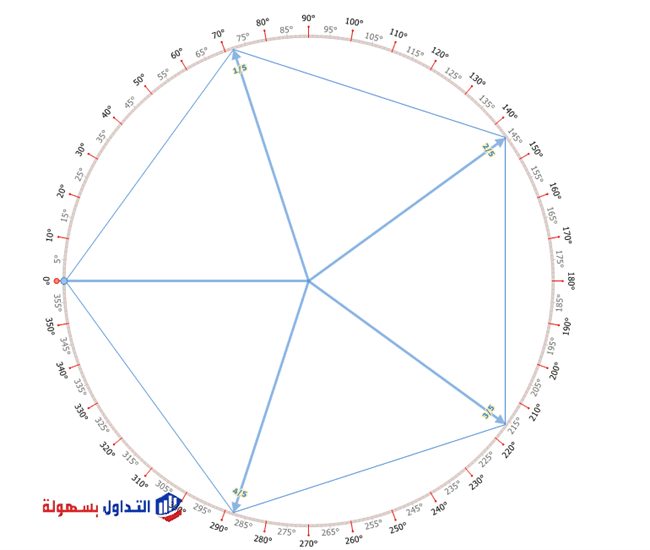
In the pentagon shape we divide the circle angle that represents the full cycle, 360, by five, the number of sides of the shape, to get the first reversal angle, which is 72. Price then reverses from it to the sub-angle 36, which represents half the distance of the 72 angle, then to the 144 angle, which is double the 72 angle, then to the 216 angle, then to the 288 angle, then completes the cycle to the 360 angle.
Price angles: the hexagon shape
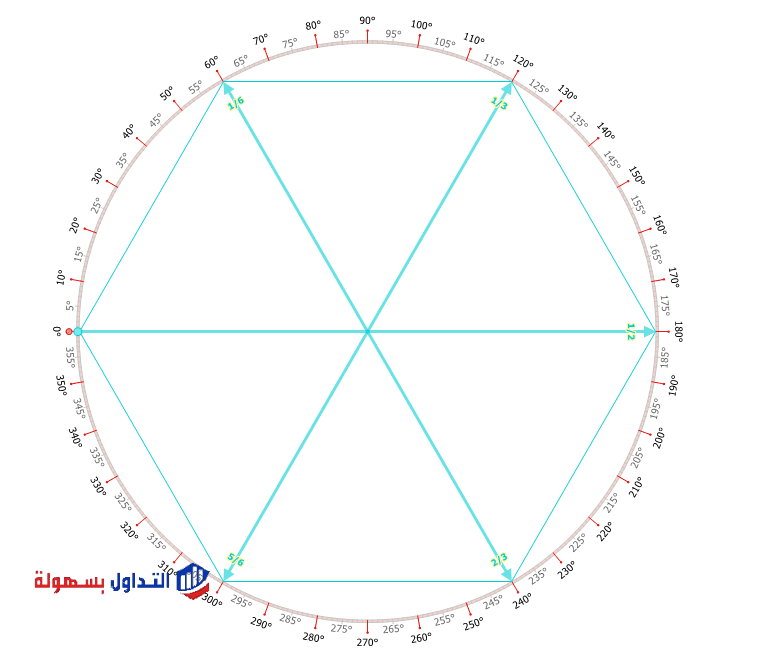
In this shape we divide the circle angle, 360, by the number of sides of the shape to get the first reversal angle, which is 60. Price corrects from it to the sub-angle 30, which represents the midpoint of the 60 angle, then reaches the next main angle, 120, which is double the 60 angle, then reaches the following main angle, the 180 angle, which is triple the 60 angle, then the 240 angle, then the 360 angle. This is one of the price-angle shapes.
Price angles: the heptagon shape
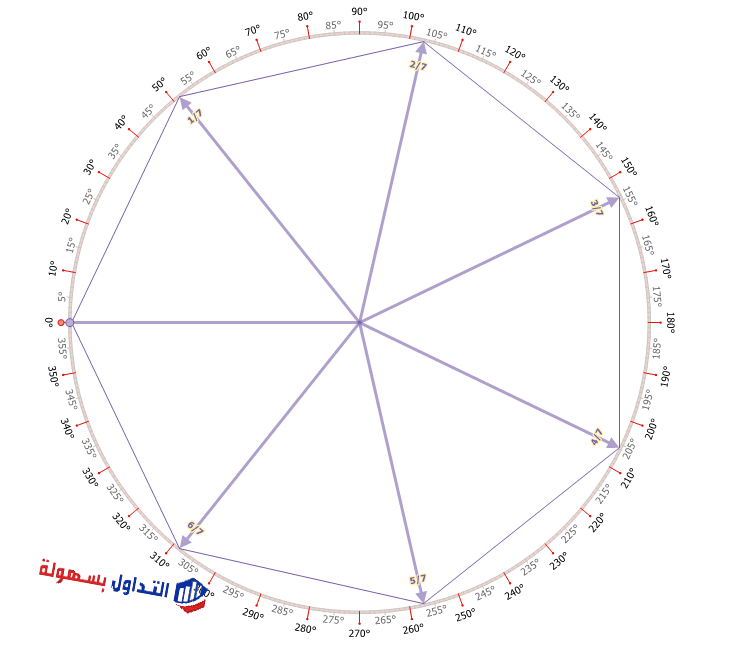
In this shape we divide the circle angle, 360, by the number of sides of the shape, making the first reversal angle 51.42, then price corrects from it to the sub-angle 25.71, then the trend resumes to reach 102.85, then the 154.28 angle, then the 205.71 angle, then the 257.14 angle, then the 308.57 angle, then the 360 angle.
Price angles: the octagon shape
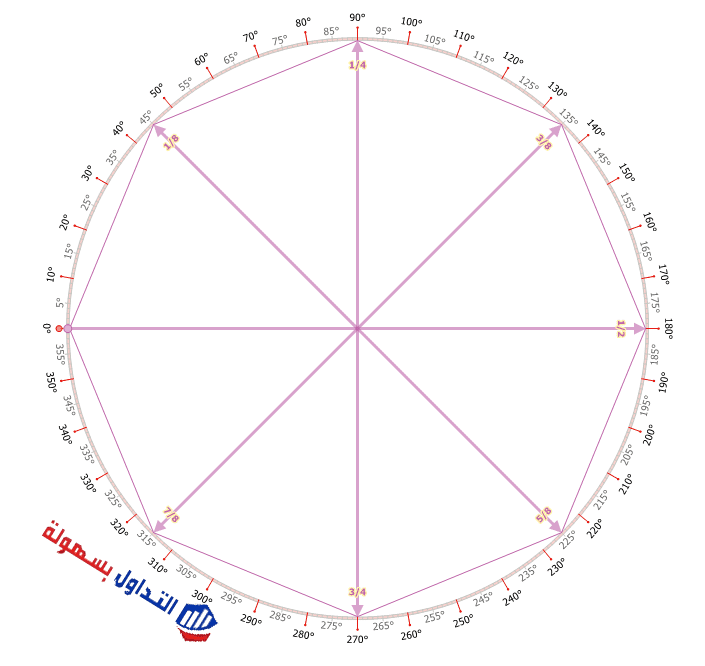
In this shape we divide the circle angle, 360, by the number of sides of the shape to get the first reversal angle, which is 45, then it corrects to the sub-angle 22.5, then the trend resumes to reach 90, then the 135 angle, then the 180 angle, then the 225 angle, then the 270 angle, then the 315 angle, then the 360 angle.
Price angles: the nonagon shape
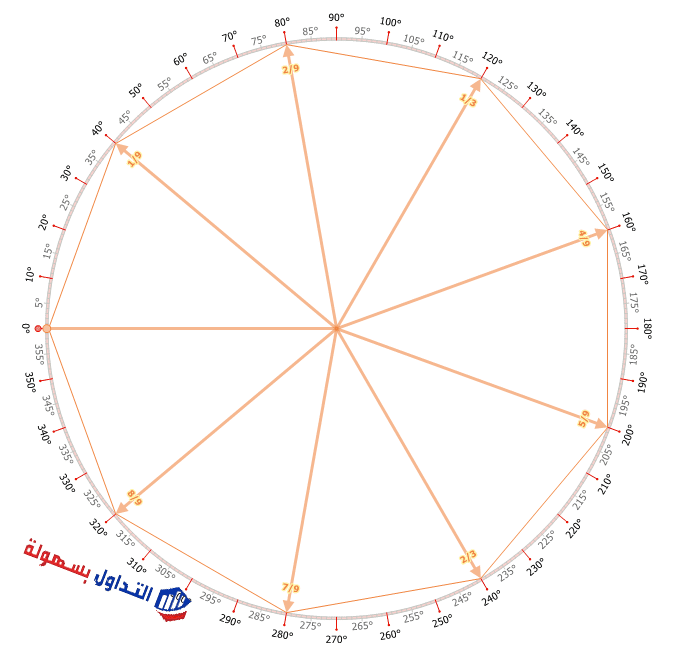
In this shape we divide the circle angle, 360, by the number of sides of the shape to get the first reversal angle, which is 40. Price corrects from it to the sub-angle 20, then the trend resumes to reach the 80 angle, then the 120 angle, then the 160 angle, then the 200 angle, then the 240 angle, then 280, then the 320 angle, then the 360 angle.
Price angles: the decagon shape
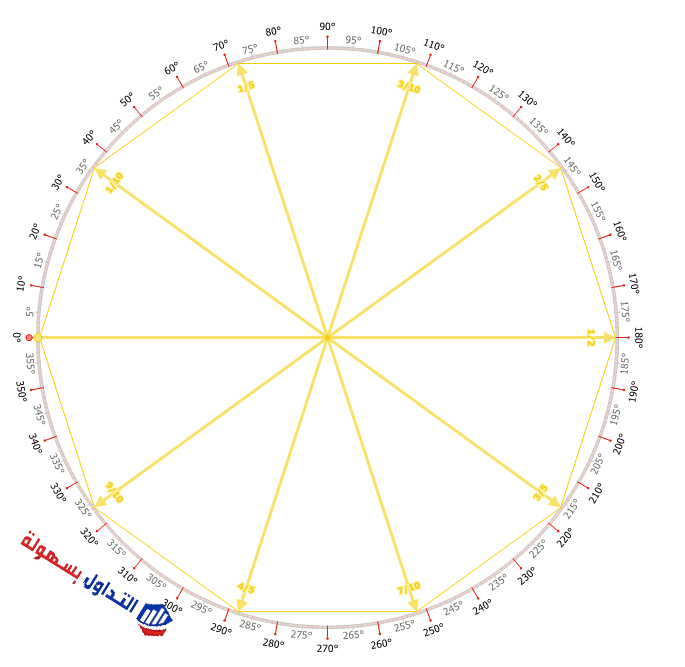
In this shape we divide the circle angle, 360, by the number of sides of the shape to get the first reversal angle, which is 36. Price corrects from it to the sub-angle 18, and the trend resumes to the 72 angle, then the 108 angle, then the 144 angle, then the 180 angle, then the 216 angle, then the 252 angle, then the 288 angle, then the 324 angle, then the 360 angle.
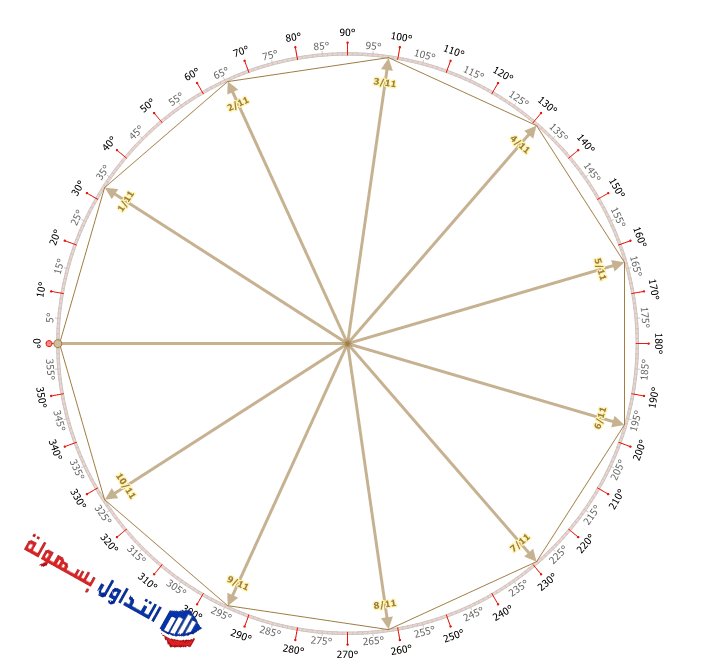
Price angles: the eleven-sided shape
In this shape we divide the circle angle, 360, by the number of sides of the shape to get the first reversal angle, which is 32.73. Price corrects from it to the sub-angle 16.36, and the trend resumes to the 65.45 angle, then the 98.19 angle, then the 130.90 angle, then the 163.64 angle, then the 196.36 angle, then the 229.09 angle, then the 261.5 angle, then the 294.55 angle, then the 227.27 angle, then the 360 angle.
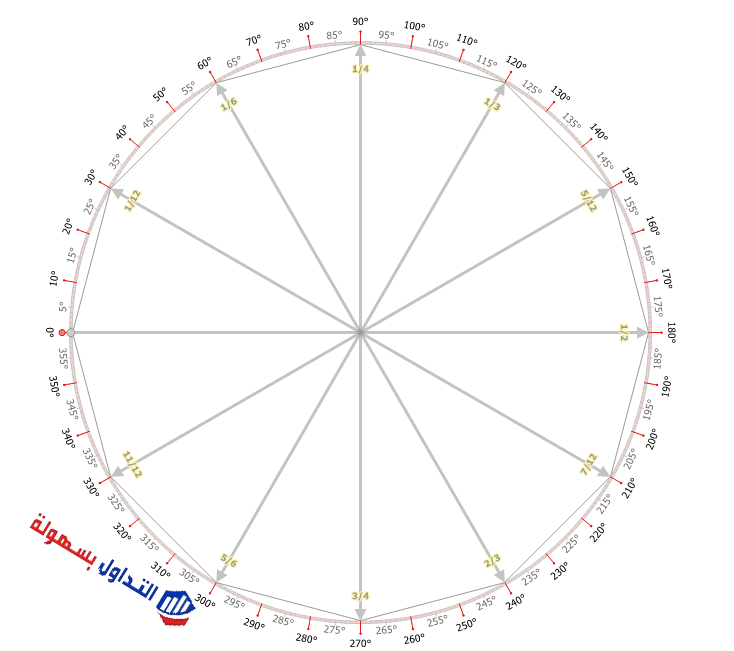
Price angles: the twelve-sided shape
In this shape we divide the circle angle, 360, by the number of sides of the shape to get the first reversal angle, 30. Price corrects from it to the sub-angle 15, and the trend resumes to the 60 angle, then the 90 angle, then the 120 angle, then the 150 angle, then the 180 angle, then the 210 angle, then the 240 angle, then the 270 angle, then the 300 angle, then the 330 angle, then the 360 angle. This is the last shape in the price angles.
From the above it is clear that all the previous shapes can be calculated as follows:
First: divide 360 by the number of sides of the shape to get the first reversal angle.
Second: take half the reversal angle to get the sub-angle.
Third: increase the angles by the amount of the reversal angle until you reach the 360 angle, in order to get the rest of the main angles.
Note: in most cases, the shapes from the hexagon up to the twelve-sided shape do not complete their full cycle to reach the 360-degree angle.
Note: price may pass the sub-angle, but the shape fails if price passes the zero angle.
Read also: Time analysis, what are time cycles?
The time intervals
- The time intervals represent the number of candles over which price will move, meaning you can estimate the timing of a price reversal from a given level by determining the time intervals.
- We mentioned above in the indicator settings that there is an option to set the time intervals, but on what basis do you set that interval?
- The default rule for setting the time intervals is that the time interval should be half the price angle. So if the reversal angle equals 120, the time interval equals 60, and if the price-time angle equals 180 the time interval equals 90, and so on.
- But sometimes the price move is somewhat fast. In this case you will notice price has entered the next square before crossing the time interval, and here we set the time interval to be a quarter of the price angle rather than half.
- The price move may also be slow. You will notice price finished the first square but did not enter the second square. In this case we set the time interval to equal the price angle. If price finishes the first square and does not enter the second, we double the time interval again to become double the price angle.
Note the following figure:
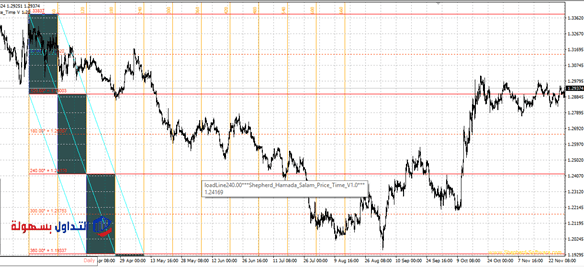
In the figure above price was moving in a triangle shape, meaning the reversal angle equaled 120. We set the time interval to half the reversal angle, and the move was slow, as price finished the first square and did not enter the second square. We increased the time interval to equal the price angle, making it 120, and the result was as in the following image.

Here too price finished the first square and did not enter the second square, so we doubled the time interval to make it 240, and the result was as in the following image.
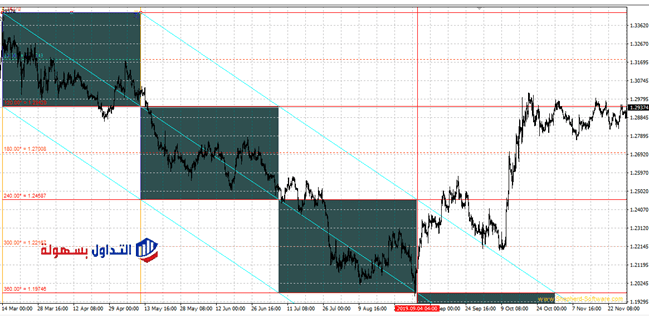
You will notice in the figure above that price was moving inside the channel and did not leave it. It stayed within its defined range and completed the cycle at its scheduled time, as shown on the chart.
At the end of the article, I hope you have benefited well from how price-time angles work and how to trade with them. I always remind you that you should not trade directly on a real account using any method or strategy you have learned until you have tested it on a demo account and made sure you have mastered it well.
Put the theory into practice
Concepts become far easier to understand once you see them on a live chart. A demo account gives you real market data with no capital at risk while you build familiarity.
Advertising disclosure: partner link. Easy Trade may receive compensation. Educational content, not financial advice. CFDs carry a high risk of losing your capital.
Conclusion
- Price-time angles are a method for showing the relationship between price and time in order to estimate possible upcoming moves, by identifying support and resistance zones. The core idea behind using price-time angles is that price moves within a defined range that can be measured through geometric angles, and once you identify the first angles you can estimate where and when the following angles may form.
- The core idea of price-time angles was derived from the Square of Nine that Gann developed.
The value price is expected to reach is calculated using the following mathematical equation:
Price value at a given angle = (square root of the price + or − the angle coefficient), with the whole bracket squared.
Where the angle coefficient = the angle value divided by 180.
If price is in an uptrend the calculation uses addition, and if it is in a downtrend the calculation uses subtraction.
The geometric shapes: one of the applications of price-time angles. Through these shapes you can estimate the price the market is expected to reach by knowing the reversal angle, since each shape has its own reversal angle, and each shape has distinct characteristics that set it apart from the others.
The angle of the geometric shapes can be calculated as follows:
First: divide 360 by the number of sides of the shape to get the first reversal angle.
Second: take half the reversal angle to get the sub-angle.
Third: increase the angles by the amount of the reversal angle until you reach the 360 angle, in order to get the rest of the main angles.
In most cases the shapes from the hexagon up to the twelve-sided shape do not complete their full cycle to reach the 360-degree angle.
There are two cases for the circular shape: in the first, price moves from the zero angle to the 360 angle directly without correcting to any of the lower angles; in the second, price moves from the zero angle to the 270 angle, corrects from it to the sub-angles 180 or below, then completes the move to the 360 angle.
Read more about time analysis and price angles
- Time analysis: what is the Gann Grid?
Disclaimer: This article is for educational purposes only and is not investment advice or a recommendation to trade. Gann price-time angles are an analytical tool that indicates possible support and resistance zones; the levels it produces are estimates, and any signal can fail. Trading forex and CFDs carries a high level of risk due to leverage and can result in the loss of all your capital. Test any method on a demo account first, and only risk money you can afford to lose. This site may earn a commission from broker links at no extra cost to you.