
Island Reversal Pattern: Can It Even Form on a Forex Chart

An island reversal is defined by two gaps, one on each side of an isolated group of bars. That definition was written for markets that close every night. Spot forex quotes run through the trading day without a break, which raises a question none of the pages ranking for this pattern asks: can the shape form here at all.
It can, but only in two places, and both of them are on the calendar rather than in the market. Which two, why the same chart produces an island on one broker feed and not on another, and what happens to an island when the chart timeframe changes, are what follow.
Key takeaways
- The pattern needs a gap on each side of an isolated cluster of bars, pointing opposite ways, so a single gap followed by a drift back is not an island.
- A gap needs a break in quoting. MetaQuotes documents quoting sessions with a beginning and an end for each symbol and each day of the week, and the space between one session ending and the next starting is the only place a gap can appear.
- On a spot forex chart that leaves two breaks: the weekend, and the daily changeover at the end of the trading day set by the broker.
- Session times and the day the three-day rollover is charged are per-symbol properties set by the broker, so an island present on one feed can be absent on another and neither chart is wrong.
- The same break falls inside a bar on one timeframe and between bars on another, so an island that appears on only one timeframe is a property of the bar boundaries.
Table of contents
- What an Island Reversal Actually Requires
- Why the Gap on Each Side Is the Whole Pattern
- Whether a 24/5 Forex Chart Can Produce One
- The Two Breaks Where a Forex Gap Really Happens
- Why the Same Chart Shows an Island on One Broker and Not Another
- What the Timeframe Does to an Island You Think You Found
- Telling an Exhaustion Gap From a Breakaway Gap
- What to Check Before Calling It an Island
What an Island Reversal Actually Requires
Three conditions have to hold together. A group of one or more bars sits at a price band of its own. A gap separates that group from everything before it. A second gap separates it from everything after it, and the second gap points the opposite way to the first.
The group is the island and the empty price band on either side is the water. Remove either gap and the shape is something else: a single gap with a recovery, or a cluster of bars that simply happens to be the local extreme.
No bar shape is specified anywhere in that definition. An island can be built from long bodies, from doji, from any mixture, and the pattern is unaffected. That separates it from the reversal patterns built from candles, where the shape of the individual bar is the signal. Here the shape carries nothing and the isolation carries everything.
The number of bars in the island is also unconstrained. One bar qualifies if both gaps are present. A cluster of six qualifies on the same terms. What matters is that no bar in the group trades into the price band occupied by the bars on either side. A comparable freedom sits in the inverse head and shoulders pattern, where one vendor reference does not require the two shoulders to reach the same height.
Why the Gap on Each Side Is the Whole Pattern
The opening gap is common. Price leaves a band untraded, carries on, and the gap becomes a feature of the chart. That happens without any reversal following it.
The closing gap is what turns the first into an island, and it is the part that cannot be assumed while the cluster is forming. Until price leaves the band in the opposite direction, and leaves it with a gap rather than a drift, there is no island on the chart. There is a gap and some bars after it.
This has a consequence worth stating plainly, because none of the pages ranking for this pattern states it: an island is only identifiable after it is complete. The second gap is the confirming event and the confirming event is also the last event. A trader watching the cluster form is watching something that may become an island and may equally become a continuation.
It also rules out a common misreading. A gap up, several days of sideways trade, and then a slow decline back through the same band is not an island reversal. Price walked back through the water. The band was traded, so the isolation the definition requires never existed.
Whether a 24/5 Forex Chart Can Produce One
A gap is a price band that no quote passed through. On an exchange that shuts overnight, the mechanism is obvious: orders accumulate while the book is closed and the opening auction prints somewhere away from the previous close.
Spot forex has no overnight auction, and inside a quoting session there is no gap available. Price can move a long way in a short time, but every level between the start and the end of that move is quoted on the way past. A vertical run of bars is fast movement, not a gap, however steep it looks, and treating one as the first side of an island is the error that makes the pattern seem more common here than it is.
What forex does have is documented breaks in quoting. MQL5 Reference describes SymbolInfoSessionQuote as returning the beginning and the end of quoting sessions for a specified symbol and a specified day of the week, with sessions indexed from zero. Quoting therefore starts and stops on a schedule, that schedule is defined per instrument, and it is defined separately for each weekday.
That is the whole answer to whether an island can form on a spot forex chart. It can, in the space between one quoting session ending and the next beginning, and nowhere else. The break is scheduled rather than driven by an event, so the gap arrives at a time known in advance even though its size is not.
Anyone reproducing this on their own charts needs to know which clock those session times are quoted in, which is the broker server clock rather than local time.
This is also why the equities framing travels badly. On a stock chart the nightly break is the default state of the market and a gap can appear on any trading day. On a forex chart the breaks are few and their positions are fixed, so the question stops being whether a gap will appear and becomes whether the two available breaks happen to sit either side of an isolated cluster.
The Two Breaks Where a Forex Gap Really Happens
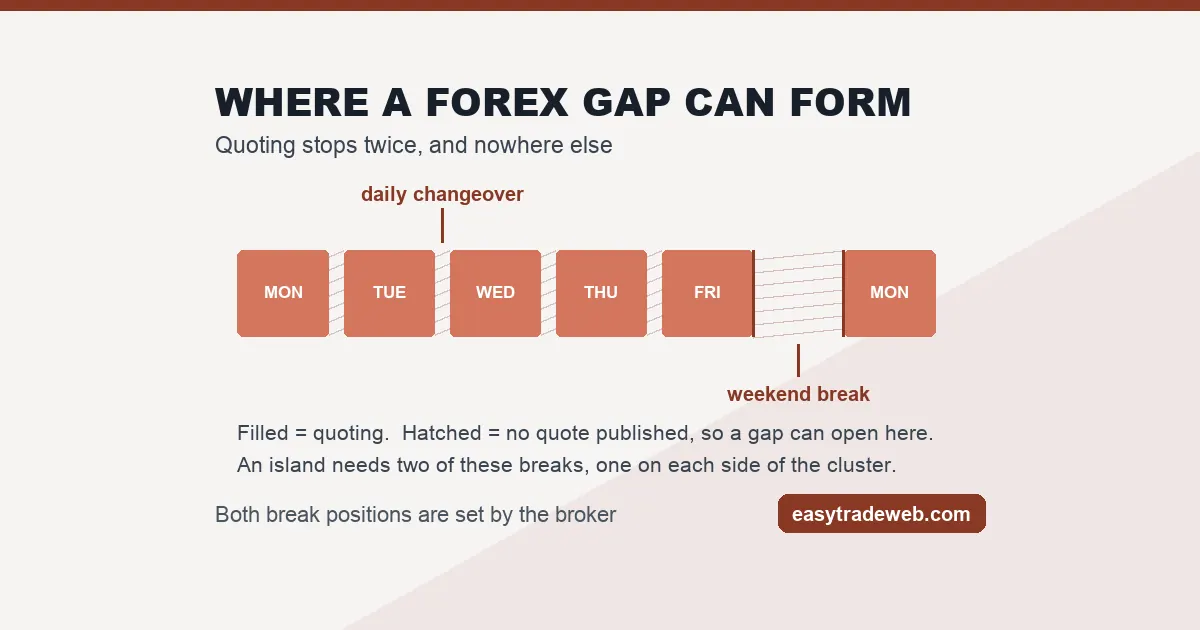
The first is the weekend. Quoting stops after the Friday session and resumes when the week opens again, and the price that returns is under no obligation to match the one that left. This is the break most traders have seen, and it is the one that carries a position across a period when nothing can be closed. What it does to an open trade is a separate subject, covered under the weekend gap and what it costs.
The second is the daily changeover at the end of the broker trading day. The daily bar has to end somewhere, and where it ends is where quoting pauses before the next day begins. On most feeds the pause is short and most days produce no visible gap at all, which is precisely why it is missed: the break is there every day whether or not price moves across it.
Both breaks are calendar events rather than market events, and that is the structural difference from the equities case. A stock gaps because something happened while the book was shut. A forex chart gaps at a moment fixed by the session schedule, and what varies is only whether price moved during it.
For an island, the arithmetic that follows is narrow. Both gaps have to land on breaks, so the isolated cluster is bounded by two consecutive breaks of the available kinds. An island one daily bar wide is bracketed by two consecutive daily changeovers. An island spanning a trading week is bracketed by two weekends. Nothing in between is available, because there is no third place for a gap to form.
| Property | Weekend break | Daily changeover |
|---|---|---|
| How often it occurs | Once per trading week | At the end of every trading day |
| Who sets its position | The broker, through the session schedule for that symbol | The broker, through the session schedule for that symbol |
| Same on every feed | No | No |
| Visible on a daily chart | Between the last bar of one week and the first of the next | Between every pair of adjacent bars |
| Visible on an intraday chart | Yes, as a long unquoted stretch | Only if price moved across the pause |
Why the Same Chart Shows an Island on One Broker and Not Another
Both breaks are set by the broker, and the platform documentation says so in the type system rather than in prose. Session start and end times are read per symbol and per day of the week. The day on which the three-day rollover is charged is a per-symbol property, MQL5 Reference typing SYMBOL_SWAP_ROLLOVER3DAYS as a day-of-week value, which means the broker chooses it for each instrument.
Two feeds quoting the same currency pair can therefore place the daily changeover at different clock times, end the week at different moments, and produce daily bars that cover different spans of the same market. None of that is an error on either side. It is a configuration choice that each broker makes and publishes in its own contract specifications.
The consequence for this pattern is direct. An island depends on a price band being untraded, and the boundary of the untraded band is the boundary of the break. Move the break by an hour and the bars either side change their highs and lows. A band that was clear on one feed is entered on another, and the island disappears without any difference in the underlying market.
This is the check that costs the least and is done the least often. Before an island is treated as real, it is worth opening the same pair and the same period on a second feed. An island that survives on both was produced by price. An island that appears on one is a property of that broker session schedule.
What the Timeframe Does to an Island You Think You Found
Chart periods are a fixed documented set. MQL5 Reference lists them from one minute through to one month, and the daily period sits directly beside the weekly one with nothing between them. A break of a given length is therefore measured against whichever of those periods the chart is drawn on.
A pause that lasts less than one bar of the chart falls inside a bar and leaves no gap. The same pause on a shorter period falls between two bars and shows as a gap. The market did the same thing in both cases and the chart reports it differently, because the only thing that changed was where the bar boundaries fall.
That produces two failures in opposite directions. Move up in timeframe and an island can be swallowed: both its gaps land inside single bars and the isolated cluster becomes part of a longer bar with no water around it. Move down and gaps appear at every changeover, so clusters that look isolated are everywhere and most of them mean nothing.
The test is the same one as for the broker feed. Redraw the period on either side of the one where the island was spotted. A shape that holds across two periods is describing the market. A shape that exists on exactly one period is describing the bar boundaries of that period, and there is no reversal in it to trade.
Telling an Exhaustion Gap From a Breakaway Gap
The two gaps carry names inherited from the equities case, and the names bring a causal story with them that does not survive the move to a currency chart. The opening one is called an exhaustion gap and the closing one a breakaway gap. In a market that shuts every night those labels describe something real: demand that ran out while the book was closed, then a fresh move away from the band once it reopened.
Neither description fits what produces the two gaps here. Both are made by a pause in quoting that was scheduled before the week started, and it arrives on time whether or not anything has run out.
What the labels still do on a forex chart is mark position: which gap came first and which completed the shape. That matters before a rule is copied from a source written for stocks, where the same two words are meant to explain why the gap happened rather than where it sits. The wider classification of gaps is set out separately under how price gaps are traded.
One thing is absent from this page deliberately. Pages describing this pattern regularly attach a reliability figure to it, and no source publishes one that can be checked. A number quoted from another education page is not a measurement, so no success rate, win rate or reliability figure appears here at all.
What to Check Before Calling It an Island
Four questions settle it, and the order matters because each one is cheaper than the one after it.
Are both gaps present, and do they point opposite ways? If the second is a drift back through the band rather than a gap, the shape fails the definition and nothing else needs checking.
Does each gap sit on a scheduled break? A gap inside a quoting session on a spot forex chart is a fast move that the chart has drawn as a jump. Only the weekend and the daily changeover produce a real one.
Does it survive on a second broker feed, and on the period above and below? These are the two tests that separate a market event from a charting artefact, and both take under a minute.
If the answer to all four is yes, the island is real in the sense that price genuinely left a band untraded on both sides. That is a description of what happened, not a forecast of what follows, and this page attaches no probability to it because none can be sourced. If the answer to any is no, the shape belongs to the chart settings rather than to the market.
Risk warning: this page is educational and describes how a chart pattern is defined and where the conditions for it can exist on a spot forex chart. It is not advice to open, hold or close any position, and identifying a pattern is not a method of producing a profit. A stop order does not guarantee an exit price. Leveraged trading carries a high risk of loss.