
Supertrend Indicator: Settings, Formula and What It Misses

Supertrend is drawn as a single line that sits under price in an uptrend and above it in a downtrend, flipping sides when price closes through it. That much every description agrees on.
What almost none of them settle is the part that decides how the line behaves on your chart: the band is built from Average True Range, so its width is set by the instrument you are looking at rather than by the two numbers you typed.
This page works through what the band measures, why the same settings are a different stop on gold than on EURUSD, what your platform decides for you, and how to test whether the market you are in suits the indicator at all.
Key takeaways
- Supertrend plots a band placed a multiple of Average True Range away from the midpoint of the bar, so the multiplier is a volatility multiple and not a distance.
- Because ATR is denominated in the quote units of the instrument, the same settings produce a far wider stop on gold than on EURUSD.
- The three independent pages read for this article each state a default ATR length as though one existed, and they disagree with each other on what it is.
- MetaQuotes lists Supertrend in neither its trend indicator set nor its oscillator set, so on MetaTrader 5 there is no vendor default at all and the parameters come from whichever third-party file was installed.
- The band only settles when the bar closes, which matters because a flip is the whole signal rather than one input among several.
- Counting flips over a fixed lookback gives a regime test you can compute, in place of the judgement that the indicator suits trending markets.
Table of contents
- What the Supertrend Band Is Actually Measuring
- The Formula, and What Your Platform Decides for You
- Why the Same Settings Are a Different Stop on Every Instrument
- The Band Moves Until the Bar Closes
- Counting the Flips: How Supertrend Fails in a Range
- A Regime Test Before You Use It
- Reading Supertrend Beside a Moving Average and an ATR Stop
- What Supertrend Cannot Tell You
- Frequently Asked Questions
What the Supertrend Band Is Actually Measuring
Two ingredients go into the line. The first is a reference point on the current bar, normally the midpoint between its high and its low. The second is a volatility measure, Average True Range, which is offset from that midpoint to place the band.
Average True Range answers a narrow question: over the last several bars, how far has this instrument typically travelled in one bar. MetaQuotes attributes the measure to Welles Wilder, who set it out in New Concepts in Technical Trading Systems, and defines true range as the largest of three spans.
Those spans are the current bar taken on its own, from its high to its low; the distance from the previous close up to the current high; and the distance from the previous close down to the current low. Including the previous close is what makes the measure count a gap as movement rather than ignoring it.
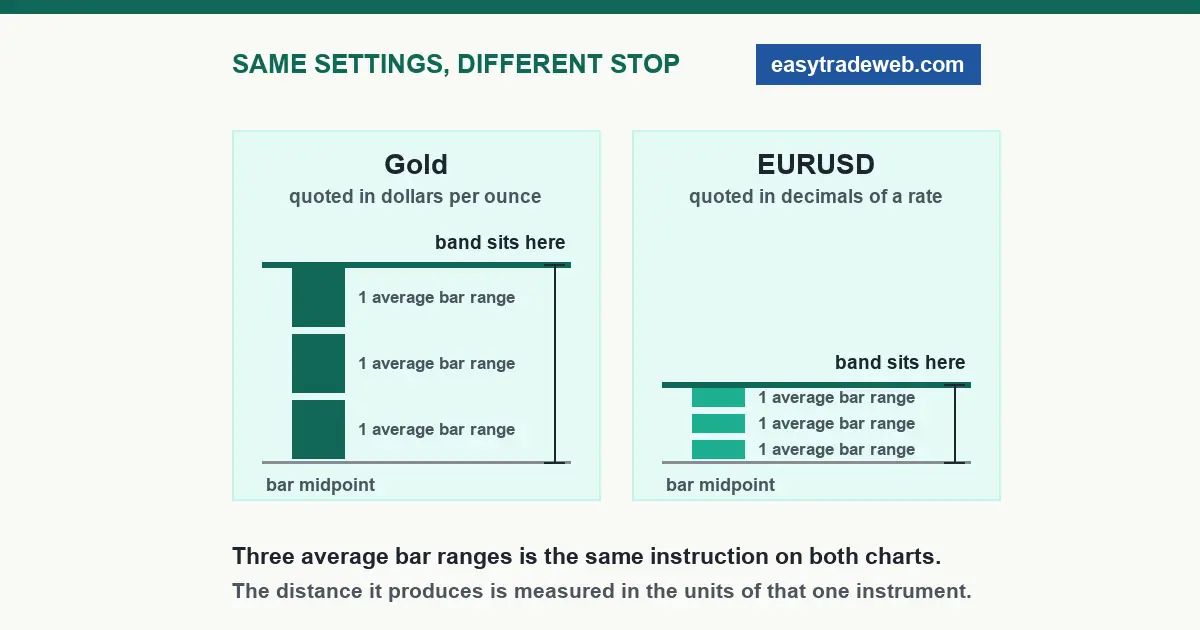
So the band is not placed a fixed number of points from price. It is placed a number of average bar ranges away, and that number is the multiplier. Everything else on this page follows from that one substitution.
The Formula, and What Your Platform Decides for You
The construction has three stages. A raw upper band sits one multiplier of ATR above the bar midpoint and a raw lower band the same distance below it. Only one of the two is drawn at any time, and which one depends on the direction currently in force.
The third stage is the one that gets skipped in short descriptions. The drawn band does not simply follow the raw calculation up and down. It ratchets: in an uptrend the lower band is held at its highest reached level and only moves further up, until a close on the other side of it forces the flip. This is why the line looks like a trailing stop rather than a channel edge.
What you cannot set is the averaging that produces the ATR term. In the MQL5 Reference the iATR function takes three arguments, a symbol, a timeframe and an averaging period, and there is no argument for the averaging method. The MetaTrader 5 help page calls ATR a moving average taken over those true range values, and never names which one.
The consequence is worth stating plainly. Two implementations can accept the same period and multiplier and still draw different lines, because the smoothing inside the ATR term and the exact ratchet rule belong to whoever wrote the indicator.
If a line differs between two platforms, compare the numeric band value on the same closed bar rather than the settings dialogs, which look identical either way. The same caution applies to any of the indicators bundled with MetaTrader rebuilt by third parties.
Why the Same Settings Are a Different Stop on Every Instrument
Search results for this indicator converge on a settings pair, and the pair is presented as a starting point that travels. It does not travel, and the reason is mechanical rather than a matter of preference.
ATR is expressed in the quote units of the instrument it was calculated on. Gold quoted in dollars per ounce produces an ATR in dollars per ounce. EURUSD produces an ATR in the fourth or fifth decimal of an exchange rate. Multiplying either by three gives a band offset in those same units, so the two results are not comparable numbers at all.
The practical version: your stop distance is the multiplier times the current ATR reading, in whatever units your platform quotes that instrument. Read the ATR value off the chart, multiply, and you have the distance in points before you have placed anything. That figure is what the position must be sized against, exactly as it would be when setting a stop from ATR directly.
This also explains why one setting can feel too tight on one symbol and too loose on the next within the same session. Nothing about the indicator changed. The volatility it is scaling changed, which is the entire purpose of scaling by volatility in the first place.
| What you set | What the platform does with it | What it is measured in |
|---|---|---|
| ATR period | Sets how many bars are averaged, so how fast the band reacts | Bars, identical on every instrument |
| Multiplier | Sets how many average bar ranges the band sits from the midpoint | Average bar ranges, so identical across instruments |
| Resulting band distance | Multiplier times the current ATR reading | Quote units of that one instrument, so different on every symbol |
| Averaging method inside ATR | Not exposed on MetaTrader 5, and not named in its help page | Decided by the implementation, not by you |
The Band Moves Until the Bar Closes
Inside a live bar the high, the low and the close are all still moving, so the true range of that bar is still moving, so the band drawn from it is provisional. A flip visible mid-bar can be gone before the bar completes.
For most tools that is a footnote. Here it is the whole signal, because the flip is the only event the indicator produces. Acting on a mid-bar flip and acting on a closed-bar flip are two different systems with different results, and the difference grows as the timeframe gets longer.
The general question of which tools redraw, and the several distinct behaviours that get filed under one label, is treated separately in our page on which indicators redraw. The narrow point that belongs here is procedural: decide once whether your rule reads the closed bar or the live one, write it down, and apply it the same way every time.
Counting the Flips: How Supertrend Fails in a Range
The failure mode is not controversial. In a market with no direction, price crosses back and forth over a band that is trying to sit outside the noise, and the line flips repeatedly. What is missing everywhere is a way to measure how badly.
Flips are countable, which makes this measurable rather than a matter of judgement. Take a fixed lookback, say the last 100 closed bars on the timeframe you actually trade, and count how many times the band changed sides across that window.
That count answers a question the settings dialog cannot. Two flips over 100 bars describes long stretches held in one direction. Twenty describes a line that changed its mind every fifth bar, and the arithmetic of that is unforgiving: each flip is an exit and a reversal, so the cost of the noise is paid twenty times whatever your spread and slippage happen to be.
The count also gives you something to compare. Run it on the same instrument across two timeframes, or on two instruments at the same timeframe, and the differences are in units you can act on rather than impressions of how the chart looks.
A Regime Test Before You Use It
Turning the flip count into a decision needs one more step, because a raw count means little without a threshold you chose in advance.
Set the threshold from your own cost of a round turn. Work out the spread and any commission on the instrument, express that as a distance, and compare it to the band distance you calculated earlier. A flip that produces a move smaller than that cost is a losing event no matter which way price then goes.
Then run the count over your lookback and ask a single question: over this window, did the moves between flips exceed the cost of taking them, more often than not. If they did not, the indicator is not broken and the settings are not wrong. The market is in a state this construction does not describe, and the correct response is to stop reading signals from it until the count changes.
Record the threshold and the lookback before you look at the result. A test chosen after seeing the chart is a description of that chart, not a test.
Reading Supertrend Beside a Moving Average and an ATR Stop
Placing the indicator next to its closest relatives clarifies what it adds and what it duplicates.
Against the moving average indicator, the difference is what sets the distance. A moving average is a smoothed price level and sits where the smoothing puts it. A Supertrend band sits a chosen number of volatility units away from the current bar, so it widens automatically as ranges expand and tightens as they contract.
Against a plain ATR stop the overlap is much larger, because both place a level at a multiple of ATR. The band adds the ratchet and the direction state; it does not add a second, independent reading of the market. Running both is one input counted twice.
Against Parabolic SAR the family resemblance is closest of all, since both are stop-and-reverse constructions that are always on one side or the other. They differ in what tightens them: SAR accelerates with the age of the move, while Supertrend responds to volatility. Neither is ever flat, which is why both need a separate regime filter rather than supplying one.
What Supertrend Cannot Tell You
The band reports one thing: which side of a volatility-scaled level the last close finished on. It carries no information about how far a move might travel, how much of the current range has already been given back, or whether the state it reports is durable.
It also cannot tell you that the market has stopped trending, because a flip looks the same whether it is the start of a move or the fourteenth reversal inside a range. That verdict has to come from the count, not from the line.
Frequently Asked Questions
What do the two Supertrend settings actually change?
The period sets how many bars the Average True Range is calculated over, which controls how quickly the band responds to a change in volatility. The multiplier sets how many of those average ranges the band sits away from the midpoint of the bar. Raising the period makes the band steadier, and raising the multiplier moves it further from price so it takes a larger move to force a flip.
Why does Supertrend look different on my platform than on TradingView?
Because the two numbers in the settings dialog do not fully specify the line. The averaging method used inside the Average True Range term is not exposed on MetaTrader 5 and is not named in the MetaQuotes help page, and the exact rule for holding the band at its previous level is written by whoever built the indicator. To compare two platforms properly, read the numeric value of the band on the same closed bar rather than comparing the settings.
Does the Supertrend line repaint?
The band belonging to the bar in progress moves while that bar is open, because the bar high, low and close it is computed from are all still changing. Once the bar closes, that value is fixed and does not change afterwards. Whether this matters depends entirely on whether a trading rule reads the live bar or waits for the close, which is a decision to make once and apply consistently.
Which timeframe suits Supertrend best?
There is no timeframe that suits it in general, but there is a way to compare candidates. Count how many times the band changed sides over a fixed number of recent closed bars on each timeframe, and compare the moves between flips against the cost of a round turn on that instrument. The timeframe where moves between flips clear that cost more often is the one the construction currently describes.
Is Supertrend enough on its own?
It reports one state, which side of a volatility-scaled level the last close finished on, and it is always in one state or the other. It never signals that conditions are unsuitable, so nothing in the indicator can tell a reader to stand aside. A separate regime measure has to supply that, and pairing it with a second tool built on Average True Range adds no independent information because both read the same underlying quantity.
Risk notice. This page is educational. It explains how an indicator is constructed and how to test whether it fits the market you are looking at. Nothing here is a recommendation to buy or sell any instrument, no settings are presented as profitable, and no result is stated or implied for any strategy. Leveraged trading carries a high risk of loss.