
Parabolic SAR Indicator Explained

The Parabolic SAR indicator helps traders identify the current direction of price movement, and it also provides entry and exit points in the market. In this article, we give a simple explanation of the Parabolic SAR indicator, also known as the Stop and Reverse indicator.
What Is the Parabolic SAR Indicator?
Parabolic SAR is one of the trend indicators, developed by J. Welles Wilder. It is used mainly to identify the direction of a security, and is also known as the “Stop and Reverse” indicator.The Parabolic SAR indicator appears on the chart as dots either above or below the price. When the dots are below the price, this indicates that the price is in an uptrend, and conversely, when the dots are above the price, this indicates that the price is in a downtrend. Naturally, any change in the position of the dots signals a change in the price direction. Supertrend is built on the same stop-and-reverse principle, but it sets its distance from volatility rather than from the age of the move.
How Does the Parabolic SAR Indicator Work?
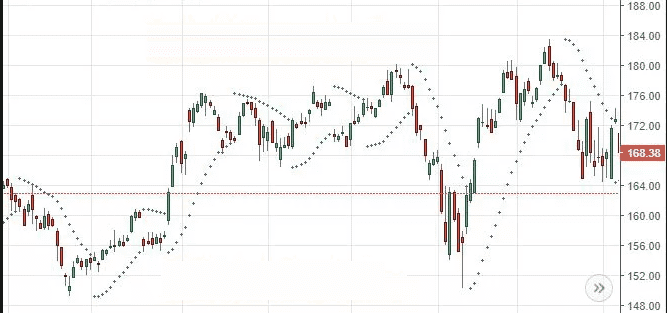
Since the Parabolic SAR is a trend indicator, it works well during trending moves, while in sideways moves it produces a lot of false signals. In the chart below, you will notice that the Parabolic SAR shows many false signals because the price is moving within a sideways range.
The following chart shows a directional move in a downtrend; you will notice that the indicator gives clear signals without as many errors as in the previous chart.

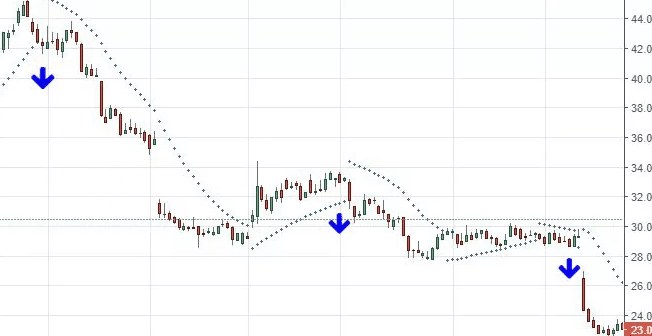
The Parabolic SAR indicator can also be used to identify trade entry areas and stop-loss orders. When the dots are below the price, this indicates an uptrend and buy trades can be opened; likewise, when the dots are above the price, this indicates a downtrend and a sell trade can be opened. A stop-loss order can be placed near the last three dots, whether in a downtrend or an uptrend. But remember that the Parabolic SAR indicator is not suited for use on its own — you can combine it with your own strategy or with other indicators.
Conclusion
The Parabolic SAR indicator is used to identify the trend and to set stop-loss orders. The indicator tends to produce good results in trending moves, but it generates many false signals once the price starts moving sideways. In the end, remember that the Parabolic SAR indicator is best not used on its own — it should be combined with other indicators.
Test this indicator without risking capital
Reading about an indicator is not the same as watching it behave on a live chart. A demo account lets you apply the settings above to real market data and see how the signals form before any money is involved.
Advertising disclosure: partner link. Easy Trade may receive compensation. Educational content, not financial advice. CFDs carry a high risk of losing your capital.
Disclaimer: This article is for educational purposes only and does not constitute investment advice or a recommendation to trade. Trading CFDs and leveraged products carries a high level of risk and may not be suitable for all investors; you could lose more than your initial deposit. Past performance of any indicator or strategy is not a guarantee of future results. This page may contain affiliate links, and we may earn a commission if you sign up through them, at no extra cost to you. For more, read about ADX Indicator Best Settings.