
ATR Indicator: Setting Stop Loss

The ATR indicator is one of the most widely used tools among forex traders. It measures market volatility efficiently and helps set a stop-loss with excellent precision. This article gives you a simple explanation of the ATR indicator and how it works.
What Is the ATR Indicator?
It is one of the volatility indicators, which measures the volatility occurring in the market. True range is also the quantity the Vortex Indicator divides by, which is what turns its two lines into ratios rather than distances. It is also what sets the width of channels built on ATR, where a multiplier applied to it decides how far each band sits from the centre line. It is denoted by the symbol “ATR,” short for Average True Range.
How to Add the ATR Indicator to Your Trading Platform?
The ATR indicator, known as the Average True Range, can also be used to build a complete trading system or used for entry and exit signals as part of a strategy. Professional traders have used the ATR indicator for decades to improve their trading results, so it is worth discovering how to use it and why you should try it.
Fortunately, the ATR indicator is already built into the MetaTrader platform, so you won’t need to download or install it. All you have to do is follow these steps as shown in the image below. In this window, you can set the period the indicator will be calculated over. As you can see, the default setting for the indicator is 14 periods.
Understanding How the ATR Indicator Works
The ATR indicator can be used for two purposes:
Measuring Volatility or Market Activity
The ATR indicator is used to measure the volatility occurring in the market, not the direction, as some believe. A low reading on the indicator shows weak movement or that the market is trading within a narrow, limited range, while a high reading shows that the market is active or volatile. The same reading cannot be compared straight across instruments, which is what makes any ranking of most volatile forex pairs depend on the unit it was built in. Look at the following chart. 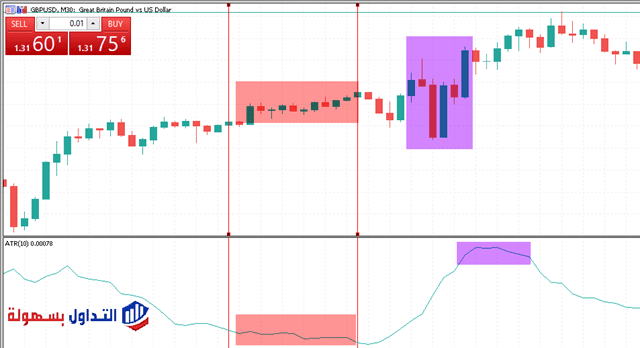 In the chart above, notice that the market was moving within a narrow, limited range when the indicator was low, and the trend was strong and rising when the indicator reading was high. Notice the difference in candle size.In the chart above, the trend was upward, and the low indicator reading (at the bottom) shows low market activity, while the high indicator reading (at the top) shows a strong trend. Look at the following chart and compare it with the previous one.
 In the chart above, notice that the market was in a downtrend. The ATR indicator reading was low when the price was moving within a limited range, and the ATR indicator reading was high when the price was moving in a downtrend, which shows that the ATR indicator has no relation to direction.
Setting the Stop-Loss Order

The main purpose the ATR indicator was created for is to reduce losses by setting a stop-loss order at a level the price is unlikely to return to except through a reversal. Of course, when using the ATR indicator to set a stop-loss order, you need to make sure it fits the risk management strategy you follow. A related construction, a Chandelier Exit, subtracts the same kind of volatility distance from the highest high of a lookback window rather than from the entry price, which is why the level it produces can move in either direction.
How Is the Stop-Loss Calculated?
The ATR indicator gives a reading of the average price movement over a set number of candles, in points. This reading appears at the top left of the indicator, as shown here:All you need to do to set a stop-loss order is take the average point reading from the indicator and multiply it by 3, then place the stop-loss order at that distance from your entry point. Look at the following chart:In the chart above, the indicator reading was 9 points, meaning the average price movement over 14 candles equals 9 points.We multiplied 9, the indicator reading, by 3, a fixed value, and got 18, which is the stop-loss distance from the entry point. The Supertrend band applies that same multiple automatically and plots the result as a line, rather than leaving it as a distance to work out each time.
Conclusion
- The indicator is one of the volatility indicators, which measures the volatility occurring in the market. It is denoted by the symbol “ATR,” short for Average True Range.
- It can be used to measure market volatility and set a stop-loss, but it cannot be used to determine direction.
Test this indicator without risking capital
Reading about an indicator is not the same as watching it behave on a live chart. A demo account lets you apply the settings above to real market data and see how the signals form before any money is involved.
Advertising disclosure: partner link. Easy Trade may receive compensation. Educational content, not financial advice. CFDs carry a high risk of losing your capital.
Related reading: Liquidity Indicator.
Read More:
- How to Use the Double Commodity Channel Index (DCCI) Indicator in Trading
- Pound Gains Despite the Absence of a Warning Trade
Disclaimer: This article is for educational purposes only and does not constitute investment or trading advice. Trading forex and CFDs involves significant risk due to leverage and may not be suitable for all investors; you could lose more than your initial deposit. Past performance does not guarantee future results. This article may contain affiliate links, and Easy Trade Web may earn a commission if you open an account through them, at no extra cost to you. To pin this to a number instead of a guess, size the trade around that stop distance.