
Support & Resistance Zones Indicator

The Support/Resistance Zones Extraction indicator is easy to use, highly effective, and free. With this indicator you can see the most important support/resistance zones — the same zones watched by many traders and institutions. It helps to understand Daily Support and Resistance Indicator.
Price often reacts around these zones, though reactions are not guaranteed.
Useful for all currency pairs and timeframes.
Compatible with MetaTrader 4.
How to Use the Support/Resistance Zones Indicator
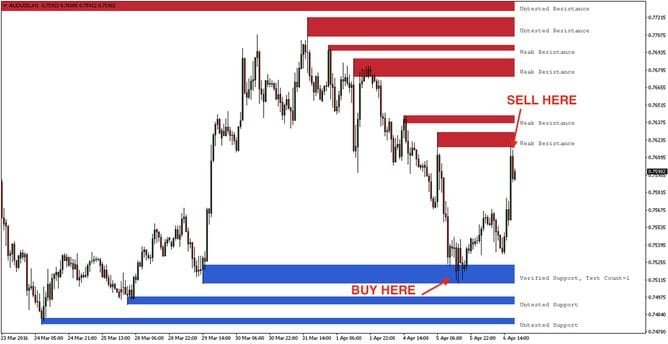
The indicator is built on support and resistance zones watched by the biggest banks, financial institutions, and many forex dealers. It shows you the most important price zones where decisive price moves happen along with the profitable opportunities that come with them. Every professional forex trader should keep an eye on these price zones.
To download the Support/Resistance Zones Extraction indicator, .
The Support/Resistance Zones Extraction indicator is one of the best ways to identify a target price by pinpointing support and resistance points. It marks support and resistance precisely — specific price points on the chart that are expected to attract the maximum volume of buying or selling — which makes it one of the best forex indicators around.
The support price is the price level where you would expect more buyers than sellers, and likewise the resistance price is the level where you would expect more sellers than buyers. Traders can therefore also use the Support/Resistance Zones Extraction indicator to pinpoint trade entry points. If you want to check it numerically, get the levels calculated for you.
There are many ways to trade supply and demand zones, and the most commonly used strategies are:
1) CSR100 Strategy – Part One: Explanation

2) CSR100 Strategy – Part Two: Application
Frequently Asked Questions:
What are support and resistance in currency trading?
Support levels are price zones with many buy orders, while resistance levels carry many sell orders. A support level predicts a floor the price will not drop below. A resistance level predicts a ceiling the price will not break above.
What is a support zone?
A support zone is where a security’s price drops to its expected lowest level, known as the support level. The support zone is a floor the price has not broken through before. It offers high-probability areas where a trend reversal or continuation may occur.
How do you draw support and resistance?
To draw horizontal support and resistance lines, you need at least one price point to anchor your horizontal line at. That price point is usually identified as a clear swing high or swing low where price bounced before.
How do I extract support and resistance levels?
One way to find support and resistance levels is to use moving averages. In a downtrend, the moving average line usually acts as resistance and price bounces off it and pulls back. In an uptrend, the moving average acts as support.
Disclaimer: This article is for educational purposes only and is not investment advice. Trading forex and CFDs with leverage carries a high level of risk and can result in losses that exceed your deposit. This page may contain affiliate links; Easy Trade may earn a commission if you sign up through them, at no extra cost to you.