
Daily Support/Resistance Indicator

The daily support and resistance indicator is one of the most useful tools in forex and CFD trading. There are many strategies for trading support and resistance, not only in forex but in other financial markets too. This article looks at one of the best daily support and resistance indicators, explains what support and resistance levels actually are, and covers the indicator’s features: You may also want to read about Support and Resistance Zones Indicator.
- A free, widely used indicator
- Extracts the support and resistance levels for the current day
- Flags the strength of these levels when trading on a lower timeframe
- Works with any currency pair on the daily timeframe
- Draws support and resistance lines for free
- Compatibility: MetaTrader 4
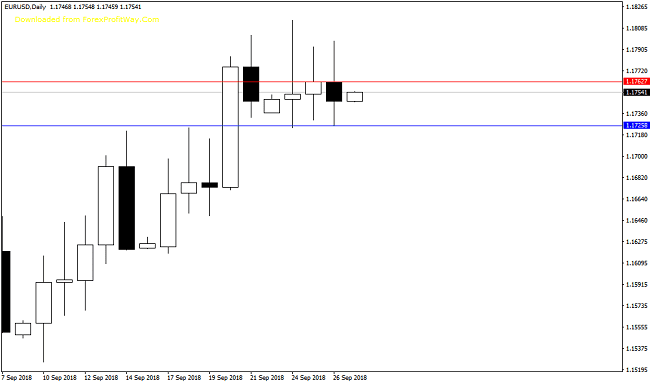
Using the Daily Support and Resistance Indicator
The main strength of the daily support and resistance indicator is that it marks the price zones followed by large banks, financial institutions, and many forex traders. It shows you the key price areas and where price moves are likely to happen, along with zones where trading opportunities can appear.
There are many ways to trade support and resistance zones, and the MetaTrader support and resistance indicator is one of the most widely used approaches when you follow these steps:
- Identify the daily trading range.
- Watch for price reversals once a support level turns into resistance, or a resistance level turns into support.
- Take profit or set a stop-loss based on support and resistance zones.
What are support and resistance levels?
You’re probably asking yourself what support and resistance actually mean in forex, or what a solid support and resistance trading strategy looks like. Here’s a straightforward answer.
Support and resistance levels are a core part of any financial market — forex works much the same way stocks do here. To understand what these levels are and how they work, it helps to first look at what creates them.
Market participants set support and resistance levels, which essentially reflect supply and demand, or liquidity flow, and that can shift quickly.
This is where buyers and sellers compete, with one side eventually winning out one way or another. Price can also react to, or get held at, a specific level where buyers and sellers reach a rough balance.
There are hundreds of ways to mark support and resistance. If a trader plots every possible line on the chart, the price itself becomes hard to see, since it gets lost behind all the lines. That’s why traders need to pick out the strongest support and resistance levels — otherwise the chart becomes unreadable and unusable.
The daily support and resistance indicator covered in this article identifies and calculates support and resistance zones. Another tool that calculates its levels instead of asking you to draw them is the Donchian channel, which marks the highest high and the lowest low of a fixed number of bars.
So how is support and resistance actually calculated? How do you draw support and resistance? And how can traders tell which levels matter most?

Support and resistance only become meaningful once the market respects certain levels most of the time. If a support or resistance level only holds occasionally, or rarely, there’s little point in a trader marking it on the chart at all.
So traders should look for the support and resistance levels that price respects most consistently, along with a solid daily support and resistance indicator for forex and stocks, to help pin down these zones accurately. Once you’re using a daily support and resistance indicator, you can apply it within a support and resistance trading strategy to help identify your own trading opportunities. To turn the explanation into an actual figure, derive the levels from the previous session.
Frequently Asked Questions
How do you draw support and resistance?
Step 1: Define your timeframe. If you want to find support and resistance for a short period, load a price chart covering at least 3-6 months.
Step 2: Mark the highs and lows.
Step 3: Connect the highs and lows with parallel lines.
How do you know a stock has broken out?
Higher-than-average volume helps confirm a breakout. If volume is thin at the breakout point, the level may not matter much to many traders, or not enough traders have committed to a position near that level yet. Breakouts on low volume are more likely to fail.
What happens when support breaks?
A break of support gives a bearish signal, and a break of resistance gives a bullish signal. In theory, once that signal appears, price moves toward the next support/resistance level, which can let you take a profit on your trade.
What is a support level?
Support is a level on a market chart where price tends to bounce during a downtrend. Say an asset is falling, but there’s a price where it stops falling. Each time it reaches that price, buyers step in and the market moves back up. That would be a support level.
What is support and resistance in crypto?
Support levels are price zones with a lot of buy orders, while resistance levels have a lot of sell orders. A support level points to a level the price is not expected to fall below. A resistance level points to a barrier the price is not expected to break above.
Disclaimer
This article is for educational purposes only and is not investment advice. Trading forex and CFDs with leverage carries a high level of risk and may not be suitable for all investors. This page may contain affiliate links; if you sign up through them, we may earn a commission at no extra cost to you.