
Reversal Zones Trading Strategy

The reversal zone trading strategy is one of the more widely used approaches you can trade. You can trade reversals in trending markets, ranging markets, and even counter-trend moves.
You can use the reversal zones strategy across many different markets, including forex, stocks, and cryptocurrencies, and you can apply it on all timeframes.
In this post, we look at exactly what the reversal zones strategy is and how you can start using it in your own trading.
What is the reversal zones strategy?
With the reversal zones strategy, you aim to trade the point where price turns and changes direction. Traders often get confused when they try to pick a market top or bottom, or wait for a trend to change, using reversal trades.
Reversal trades can be taken within a trend, within a range, and also against the trend.
For example, if you want to take a reversal trade inside a trend, you first look to identify the overall direction. In the example below, price is making a clear uptrend with higher highs and higher lows.
To take a reversal trade within this uptrend, we wait for price to move down to an important level or zone, usually a support or resistance level. We then enter buy trades from the swing low and look for price to move back up in line with the trend.
How to identify a trend reversal
You will often get a chance to take reversal trades when a trend is nearing its end.
Trading against the current dominant trend can be riskier, but it can also carry higher reward. If you can catch a new trend as it first begins, you often have the chance to ride a large winning position.
Two common ways to identify when a trend is about to reverse are the moving average crossover strategy and the 123 trend reversal.
The 123 trend reversal pattern
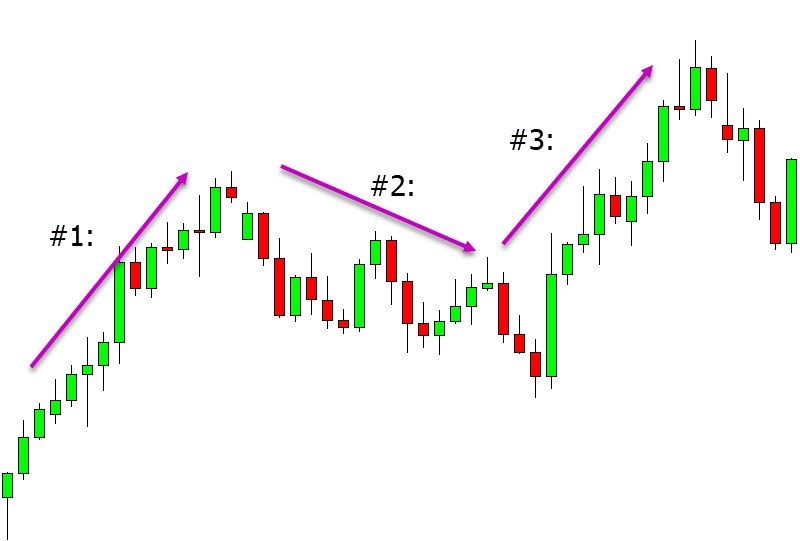
The 123 trend reversal is a price action pattern that shows a trend may be changing.
With this pattern, we have three distinct moves.
In the example below, we see a 123 trend reversal within an uptrend. After the trend has run, price makes a higher low for the first leg, followed by the second leg and a swing down. The reversal and the pattern complete when price moves up in the third leg and breaks above the high of the first leg, creating a new higher high and a new short-term trend.
Intraday reversal zones strategy
The reversal zones strategy can be applied on all timeframes, from higher-timeframe charts such as the daily chart down to intraday timeframes such as the 30-minute and 15-minute charts.
The key when reversal trading on intraday timeframes is to use the major levels as a guide, and to note whether there is any clear momentum so you can trade with it rather than against it.
In the first example below, price momentum was moving to the upside. With that in mind, we look for buy trades. When price moves down to a clear support zone, we can look to take buy trades. We then look for price to move back up with the overall momentum.
In the second example, there is no clear momentum or direction in the market. Because of that, we look at the clear support and resistance levels for possible reversal trades.
When price moves down to the intraday range support level, we can start looking for possible buy trades and aim to profit as price reverses back up away from that support.

Best trend reversal indicators
Moving averages
Moving averages are among the most common technical indicators, used across all markets.
Moving averages are used to smooth out the overall price movement and give you an idea of the market direction. They can also help you judge how strong a trend is and whether that trend may be slowing down or nearing its end.
When you use multiple moving averages in your trading, you can use them to identify trend reversals and reversal moves.
MACD
Another indicator used across all types of markets to spot new trends or momentum is the MACD.
The MACD shows information from two different moving averages and how they interact.
The MACD appears as an oscillator on your chart, moving above and below 0. Using this information, you can start to identify new trends forming and when momentum is building for a possible reversal zones setup.
A simple reversal zones strategy
Using Fibonacci and price action
One of the simplest ways to find reversal trades across all your different timeframes is by using the Fibonacci tool.
Fibonacci can help you identify when price is likely to find support or resistance and may be about to make a new reversal.
In the example below, price is in an uptrend. After price pulls back down, we see it move to the 50% Fibonacci level.
We can start looking for long reversal trades at this retracement level, in line with the uptrend.
Range reversal from key support and resistance levels
The reversal zones strategy is one you can use across all your timeframes. You can use it to scalp if you are more suited to shorter timeframes, or to swing trade if you prefer higher timeframes.
In the example below, we have a clear support and resistance range.
When price moves up into the range’s high resistance level, we can start looking for sell trades, expecting price to reject that resistance and reverse back to the downside. We can then aim to profit as price reverses back down to the low of the range and the support level.
Try this strategy on a demo account first
A strategy that looks clear in an article can behave very differently under real spreads and volatility. Testing it on a demo account shows you how it performs before you commit any capital.
Advertising disclosure: partner link. Easy Trade may receive compensation. Educational content, not financial advice. CFDs carry a high risk of losing your capital.