
Types of Reversal Candlestick Patterns

What are reversal candlestick patterns? Traders can spend hours, even days, looking for a workable way into the financial markets. Along the way, in the search for a “holy grail” entry method, they run into Japanese candlestick patterns, Elliott Wave theory, a wide range of oscillators, and other technical methods.
Even so, many beginner traders overlook one of the most important indicators of all: price itself. Price gives a trader a picture of the whole market, since it reflects the economic, political, and geographic variables acting on it.
See also: Japanese candlesticks in detail
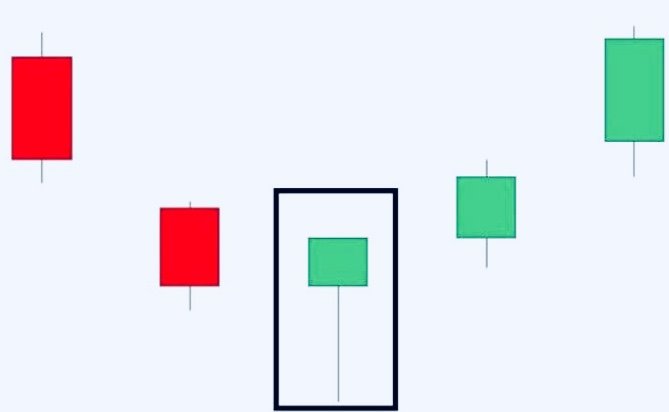
Many traders who are new to the markets struggle with reading price because they lack experience with it, so they end up ignoring it and giving it little weight. In reality, price is one of the biggest and most important indicators there is, and everything else tends to follow it.
Experienced traders often identify the best point to enter the market by focusing specifically on trend reversal — the point at which the prevailing trend starts to turn, signaling a shift toward the opposite direction. Forex trading includes a huge number of reversal patterns; three of them are covered below.
The First Reversal Pattern: Head and Shoulders
There comes a moment when the low fails to move below the previous low, after a series of highs lower than the highs before them and lows lower than the lows before them.
That is the key point at which demand starts to outweigh supply, and the market fills up with buyers looking to enter and push prices higher.
Things You Should Know About Head and Shoulders
- A recognized downtrend is assumed to already be in place.
- The downtrend forms as a series of highs lower than the previous highs and lows lower than the previous lows.
- Volume gives alerts, where available.
- Declining volume gives warnings, where available.
- A signal that a reversal may be approaching appears when the right shoulder is higher than the previous low (or head).
- Rising volume, where available, points to the start of an uptrend and the end of the downtrend.
- A minimum price target can be calculated by projecting the height of the inverse head-and-shoulders pattern from the point where price breaks the neckline.
Note: there is no real difference between candlestick patterns in stocks and candlestick patterns in forex or other markets — the same rules apply across markets when using Japanese candlesticks.
A reversal that depends on gaps rather than on the shape of a candle is the exception, because a currency chart offers far fewer places for a gap to form. The island reversal pattern is the clearest case of that difference.
The Second Reversal Pattern: Triple Bottom
This pattern is similar to the one above: the triple bottom signals that a downtrend is ending and an uptrend is beginning.
It forms from three equal or near-equal lows side by side, followed by a decisive close above the top of the pattern.
Price is expected to break above the top of this pattern; otherwise it would not count as a triple-bottom reversal.
Things You Should Know About the Triple Bottom
- A recognized downtrend is assumed to already be in place.
- Volume gives alerts, where available.
- Declining volume gives warnings, where available.
- A support area forms in the pattern when the lows are equal or near-equal.
- Rising volume, where available, points to the end of the downtrend and the start of an uptrend.
The Third Reversal Pattern: Double Bottom
Here the downtrend is at its strongest, with a series of highs lower than the previous highs and lows lower than the previous lows, before price action reverses.
Supply is outweighing demand, and negative sentiment is pushing prices down to lower and lower levels.
Volume, where available, points to early signs of weakness as it decreases while price keeps falling, sending a further warning signal when the latest low fails to move below the low before it. The double-bottom reversal pattern is confirmed once price breaks above the resistance level on rising volume.
Things You Should Know About the Double Bottom
Reversal candlestick patterns display this shift in sentiment by representing the size of price moves visually in different colors, and traders use reversal candlestick patterns to make trading decisions based on patterns that recur regularly and help indicate the likely short-term direction of price.
- A recognized downtrend is assumed to already be in place. The downtrend forms with a series of highs lower than the previous highs and lows lower than the previous lows.
- Volume gives alerts, where available.
- Declining volume points to an approaching reversal, where available.
- A support area forms in the pattern when the lows are equal or near-equal.
- Rising volume, where available, points to the end of the downtrend and the start of an uptrend. A minimum price target can be calculated by projecting the height of the double-bottom pattern from the breakout point.

There is considerable debate among traders over how reliable Japanese candlestick patterns really are. Whatever your own experience with them, it’s fair to say they reflect the psychology of everyone in the market in a compact, visually appealing form. The rest of this article walks through the most important candlestick patterns and what they mean.
Doji
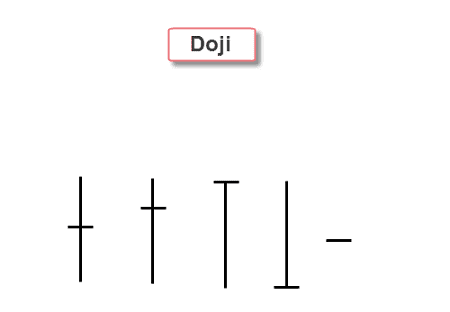
The doji is one of the most notable candlesticks: its open and close prices are the same, meaning the doji has no real body. It can form on its own or alongside other patterns, such as the morning-star or evening-star doji, both of which are reversal patterns.
A doji points to indecision in the market — neither buyers nor sellers were able to push price away from the open during that trading session. Because there is no real body, it often forms at tops, bottoms, or the end of a trend.
Hammer
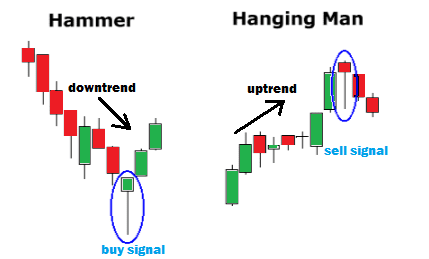
The hammer is a strong reversal pattern that often forms at the end of a downtrend. It has a long lower shadow and a small body, with the shadow at least twice the length of the body. In terms of market psychology, the hammer pattern tells us that buyers managed to push price back up after selling pressure, as shown by the long lower shadow.
A hammer that forms at the end of, or during, an uptrend is called a hanging man and shares the same characteristics as the hammer pattern, except that the long lower shadow now signals that upward momentum may be close to running out as selling pressure builds.
Engulfing Pattern
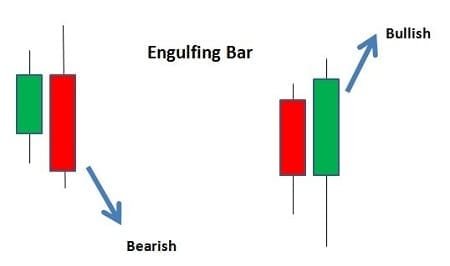
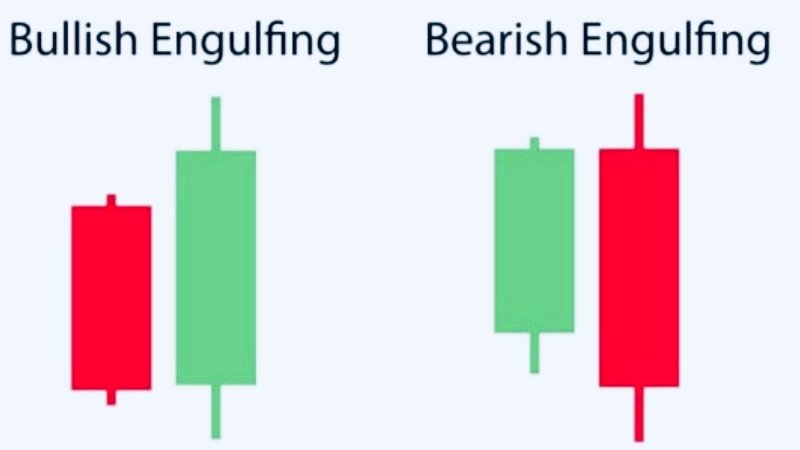
Unlike the doji and the hammer/hanging man, which are single-candle patterns, the engulfing pattern needs at least two candles to form. It is a significant reversal pattern in which the second candle completely covers the range of the first. In a bearish engulfing pattern, the down candle completely covers the previous up candle; in a bullish engulfing pattern, the up candle completely covers the smaller down candle before it.
Candlestick patterns appear on trading charts, and technical traders believe they can be used to estimate future price movement, which makes them useful for spotting new opportunities. In technical analysis, the price chart is the only factor being examined when looking at the market.
Chart and candlestick patterns are, essentially, one way of finding trades using technical analysis. Each pattern is a signal that has previously preceded a new trend, a reversal, or a continuation, and once you identify a pattern on the chart, you can look to open a trade if the same price move plays out again. Below are answers to some of the questions traders ask most often.
Frequently Asked Questions
Which candlestick pattern is considered the most reliable?
No single candlestick pattern stands out as the most reliable, but some are considered to indicate price movement more strongly than others. Among the patterns often mentioned are the three white soldiers and the three black crows, because with both patterns the resulting move tends to match the expected direction well by the time the pattern completes.
Are candlestick patterns useful?
Candlestick patterns act as a guide to the expected price move, though some are considered more reliable than others. Whichever pattern you use, you should always confirm the move and use a stop-loss, since this helps reduce risk if the pattern fails.
How many different candlestick patterns are there?
There are many candlestick patterns, and different technical traders rely on different ones, with new patterns being added over time. If you are a beginner, it may be best to focus on the handful of standard patterns covered in this article.
It also helps to use a demo account to practice trading new patterns before committing real capital — that way you can work out which ones suit you best.
How are candlestick patterns used in day trading?
Candlestick patterns are used in day trading the same way as on any other timeframe: identify a pattern on the chart, confirm the resulting move, then open the trade. Day traders tend to use shorter-term charts to spot opportunities, but the underlying principle is the same.
Test this indicator without risking capital
Reading about an indicator is not the same as watching it behave on a live chart. A demo account lets you apply the settings above to real market data and see how the signals form before any money is involved.
Advertising disclosure: partner link. Easy Trade may receive compensation. Educational content, not financial advice. CFDs carry a high risk of losing your capital.
Disclaimer: This article is for educational purposes only and does not constitute investment or trading advice. Trading forex and CFDs involves leverage and carries a high level of risk to your capital, and may not be suitable for every investor. Candlestick patterns are a way of reading price charts, not a guarantee of any future outcome, and signals from them can fail. This page may include affiliate links; we may earn a commission if you open an account through them, at no extra cost to you.