
JOLTS Report Explained: What It Measures and When It Lands

The JOLTS report is the second labour release the Federal Reserve reads each month, and it is the one traders most often describe wrongly. It is not a jobs count, it does not arrive on a fixed monthly rhythm, and the figures inside a single release do not all refer to the same stretch of time.
What follows is what the Bureau of Labor Statistics actually publishes under that name, when the 2026 calendar puts each release, and which parts of the number are still provisional after you have traded them.
Key takeaways
- JOLTS is the Job Openings and Labor Turnover Survey, a monthly establishment survey run by the Bureau of Labor Statistics that measures vacancies, hires and the three kinds of separation.
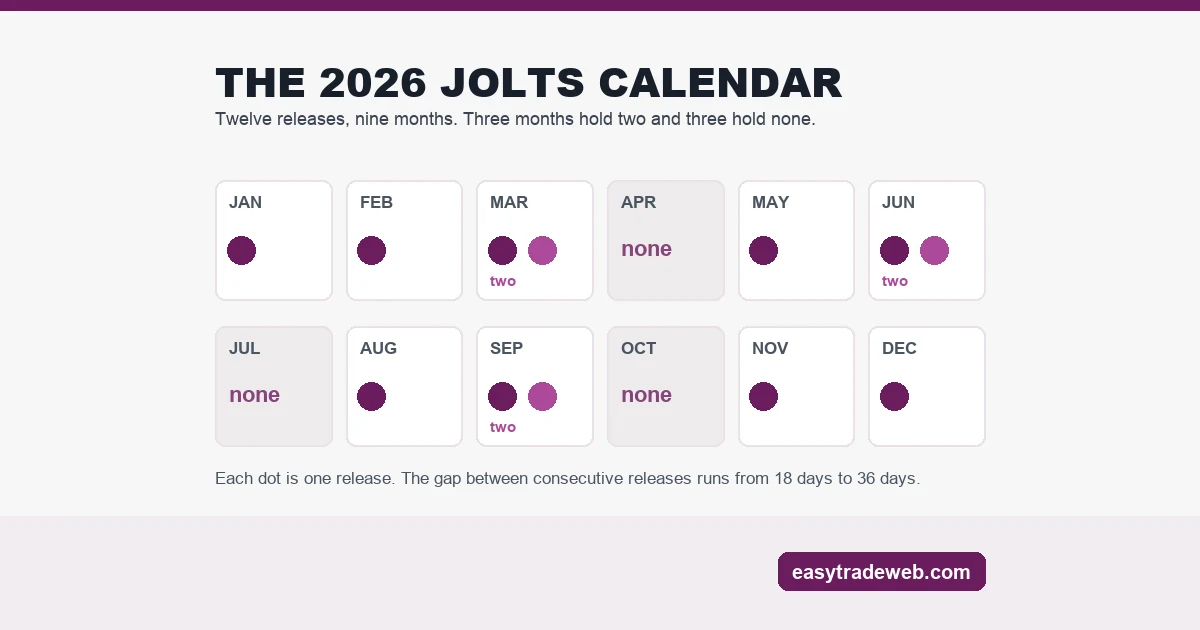
- The 2026 schedule places twelve releases across nine calendar months. March, June and September each carry two; April, July and October carry none at all.
- Openings are a snapshot taken on one day. Hires and separations cover the whole month. The employment base used for the rates comes from the pay period containing the 12th.
- Every first print is provisional. It is revised the following month, and the annual update reopens the previous five years of data.
- The sample is roughly 21,000 establishments against 631,000 for the payrolls survey, and reporting is voluntary in both.
Table of contents
- What the JOLTS Report Counts
- Three Months of 2026 Carry No JOLTS Release, and Three Carry Two
- One Release, Three Different Reference Windows
- The First Print Is Preliminary by Design
- Where the Sample Comes From, and What It Cannot Tell You
- Reading JOLTS Beside the Payrolls Report
- What Changes on the Screen at 10:00 Eastern
- Frequently Asked Questions
What the JOLTS Report Counts
JOLTS stands for the Job Openings and Labor Turnover Survey. It is a survey of employers rather than of households, and it asks each one for six numbers: how many people were on the payroll, how many unfilled positions existed, how many people were taken on, how many left of their own accord, how many were let go, and how many left for any other reason.
The vacancy figure has three conditions attached to it. There has to be a real position with work waiting to be done, the employer has to be able to start someone inside thirty days, and the employer has to be recruiting outside the existing workforce. A role advertised to internal staff only does not qualify, and neither does a post the firm has no intention of filling soon.
Separations are split three ways rather than reported as one figure. A quit is a departure the worker chose. A layoff or discharge is a departure the employer chose. Everything else, meaning retirements, deaths, and moves to another site of the same company, sits in a third bucket.
The quits line is the one that gets quoted. A worker who resigns without another offer in hand is expressing a view about how easy the next job will be to find.
None of this is a jobs count in the sense the non-farm payrolls report is. Payrolls measures the net change in employment. JOLTS measures the traffic underneath it.
Three Months of 2026 Carry No JOLTS Release, and Three Carry Two
The Bureau publishes a schedule of JOLTS releases a year in advance, and reading it destroys the assumption that the report arrives once a month in a predictable slot. Twelve releases fall in 2026. They land in nine calendar months.
March, June and September each hold two. April, July and October hold none. The gap between one release and the next is 28 days five times, 35 days three times, and then 29, 36 and 18 days once each. The 18-day gap sits between 13 March and 31 March 2026, so a trader who saw the report on the thirteenth and assumed the next one was five weeks away missed it by a fortnight.
| Reference month | Release date | Days after the month ended |
|---|---|---|
| November 2025 | 7 January 2026 | 38 |
| December 2025 | 5 February 2026 | 36 |
| January 2026 | 13 March 2026 | 41 |
| February 2026 | 31 March 2026 | 31 |
| March 2026 | 5 May 2026 | 35 |
| April 2026 | 2 June 2026 | 33 |
| May 2026 | 30 June 2026 | 30 |
| June 2026 | 4 August 2026 | 35 |
| July 2026 | 1 September 2026 | 32 |
| August 2026 | 29 September 2026 | 29 |
| September 2026 | 3 November 2026 | 34 |
| October 2026 | 1 December 2026 | 31 |
The lag from the end of the reference month runs from 29 days to 41 days across those twelve releases. There is no rule of thumb that survives that spread. The only reliable method is to read the published schedule for the year rather than to count forward from the last release.
This is the opposite of the pattern behind the Beige Book, which is pinned to the policy meeting it precedes and therefore lands on a rule you can apply. JOLTS is pinned to nothing except its own published dates.
One Release, Three Different Reference Windows
A JOLTS headline is usually read as one measurement of one month. It is three measurements of three different stretches of time, printed side by side.
Vacancies are a stock. They are counted on the final business day of the month, which makes the figure a photograph of one day rather than a summary of thirty. Hires and every category of separation are flows, accumulated across the entire month. The employment figure that turns those flows into rates comes from the pay period that contains the twelfth of the month, which is the same convention the payrolls survey uses.
| Figure | Type | Period it refers to |
|---|---|---|
| Job openings | Stock | One day: the final business day of the month |
| Hires | Flow | The whole month |
| Quits, layoffs, other separations | Flow | The whole month |
| Employment used for the rates | Stock | The pay period containing the 12th |
Two consequences follow. Adding twelve months of vacancies produces nothing meaningful, because twelve photographs of twelve separate days do not sum to a year. Adding twelve months of hires does produce an annual total, because flows accumulate.
The second consequence is about volatility. A stock measured on one calendar day carries whatever happened to be true that day, which is part of why the openings line moves more between prints than the hiring line does. That is a property of the measurement rather than a signal about the labour market.
The First Print Is Preliminary by Design
The number that moves the dollar is provisional at the moment it is published, and the Bureau says so plainly. A monthly JOLTS estimate is preliminary on first release. The following month it is recalculated with the returns that arrived late and is then treated as final.
That is one layer. The second is the annual update, which realigns JOLTS to the employment estimates from the payrolls programme and recalculates the seasonal factors. When it runs, the previous five years of data are open to revision, in both the seasonally adjusted and the unadjusted series.
So a job openings figure published today can change once next month for a mechanical reason, and again years later for a methodological one. Anyone building a view on the level of vacancies rather than the direction is building it on a number that has not settled.
The payrolls page on this site covers the revision problem for the employment count itself, and the two mechanisms are different: payrolls revises the same series twice on a fixed cadence, while JOLTS pairs a single preliminary-to-final step with a five-year annual window. The CPI report carries a third variant again, where the unadjusted index is final on release and the adjusted series keeps moving.
Where the Sample Comes From, and What It Cannot Tell You
The survey covers about 21,000 establishments, drawn from the same administrative list that underlies most Bureau employment statistics, a list covering more than 95 percent of jobs on non-farm payrolls. Reporting is voluntary. Data is gathered by telephone interview and by web form, over a collection period of roughly 45 days, with the active window running 11 to 17 business days.
Two limits follow from the design, and both matter more than the sample size does.
The first is that JOLTS collects nothing about occupation. There is no way to ask this release which kinds of job are going unfilled, because the question is never put to the employer. Claims about vacancies in a particular profession, sourced to JOLTS, are sourced to something the survey does not contain.
The second is that hires minus separations is not the payrolls number. The difference between the two flows is an implied change in employment, and the Bureau describes it as conceptually similar to the payrolls measure while noting that short-term divergence is expected.
The surveys differ in definition, in reference period and in how the estimates are built. Treating the implied figure as a check on payrolls will produce a disagreement sooner or later, and the disagreement will not mean either survey is wrong.
Reading JOLTS Beside the Payrolls Report
The two labour surveys are not the same size. Payrolls draws on about 631,000 establishments; JOLTS draws on about 21,000. Neither is the largest count of American employment published each month, since the ADP employment report is built from payroll records rather than from a survey sample at all. Both are voluntary, and both collect over a similar number of business days each month.
Plotting the openings rate from this release against the unemployment rate from the payrolls release is what produces the Beveridge curve, which is one reason the two reports are read together rather than in isolation.
That thirty-to-one difference is the reason the two releases are treated so differently by the market. A monthly move in the JOLTS openings line is a much smaller sample speaking, about a stock measured on one day, delivered more than a month after the fact. A monthly payrolls print is a far larger sample speaking about the month just ended.
Neither release carries a threshold of its own, which is what separates both from a rule such as the Sahm rule, where a single stated condition on the unemployment rate is either met or it is not. What JOLTS adds is the composition that payrolls cannot show. A payrolls gain built on high hiring and high quitting describes a different labour market from the same gain built on low hiring and almost no departures, and only JOLTS separates the two. That is the reading the rate-setting committee is doing when the quits line is discussed, and it is the reading reflected in the dot plot rather than in any single release.
What Changes on the Screen at 10:00 Eastern
JOLTS is published at 10:00 in the morning, Eastern time, which puts it after the New York equity open rather than before it. That is an hour and a half later than the payrolls and inflation releases, and it means the dollar is already trading an active session when the figure lands.
The practical effect is that a JOLTS move arrives into liquidity that is present rather than into the thin book around an early release, and it is usually read alongside whatever else is scheduled for that morning rather than on its own. Whether the reaction leans dollar-positive or dollar-negative depends on how the reading fits the policy expectation already in place, which is the subject of hawkish and dovish policy.
Frequently Asked Questions
What does JOLTS stand for?
Job Openings and Labor Turnover Survey. It is a monthly survey of employers run by the Bureau of Labor Statistics, and it reports vacancies, hires, quits, layoffs and discharges, and other separations.
What time is the JOLTS report released?
At 10:00 in the morning, Eastern time, on each of the dates in the published schedule. That is later in the session than the payrolls and inflation releases, which arrive at 8:30.
How far behind is JOLTS data when it is published?
Across the twelve releases scheduled for 2026 the gap between the end of the reference month and the release date runs from 29 days to 41 days. There is no fixed lag, so the schedule has to be read rather than estimated.
Is the first JOLTS number final?
No. Each monthly estimate is preliminary when first published and is recalculated the following month once further responses arrive. A separate annual update reopens the prior five years of data.
Does the JOLTS report come out every month?
There is one release for every reference month, but the releases do not fall one to a calendar month. In 2026 three months hold two releases and three months hold none.
Risk warning: this page is educational and explains how one statistical release is built and published. It is not advice to buy or sell any instrument, it recommends no product, platform or broker, and nothing here is a signal, a performance claim or a prediction. Leveraged trading carries a high risk of losing money rapidly.