
ADX Indicator: Best Settings

In 1978, Welles Wilder developed a technical indicator that measures the current strength of a price trend and named it the ADX indicator, short for “Average Directional Movement Index.” So what is the ADX indicator? What are its components? And how do you use it? We’ll cover all of that in this article. An indicator built on elapsed time rather than on distance travelled answers a different question again, which is what the Aroon indicator reports. See also our guide to Momentum Indicator.
What Is the ADX Indicator?
The ADX indicator is a trend indicator added in a separate window below the chart. Even though it’s plotted like an oscillator, it isn’t classified as one — it’s a trend indicator. The ADX indicator measures the current strength of a trend, and it works best in markets with a clear direction. It is also the system that the Vortex Indicator was written as an answer to, and the one both published comparisons of that tool were run against.
Components of the ADX Indicator
The ADX indicator consists of three lines, each measuring price movement in a different way:
- ADX line
- +DI line
- -DI line
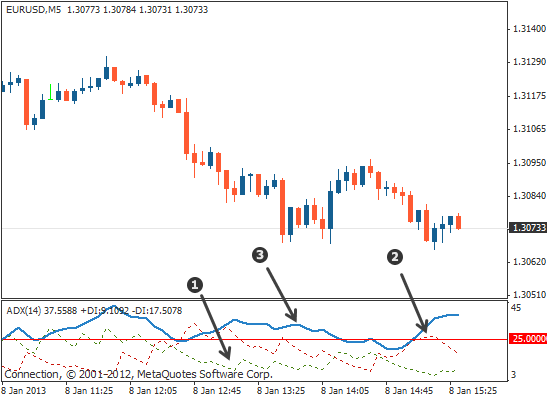
The chart below shows what the indicator looks like:
ADX indicator
In the chart above, the dotted green line represents the +DI line, the dotted red line represents the -DI line, and the blue line is the main ADX line.
Using the ADX Indicator
- The ADX line (blue) reflects the current strength of the price trend. If the ADX line moves below level 25 (the red horizontal line), that shows the trend has lost strength; if it moves above 25, that signals the trend is building strength, and the trend peaks around level 50. So when price reaches that level, think carefully before opening new trades, since a reversal often happens near these levels.
- Now that you know how to measure trend strength, the next step is determining the direction using the +DI and -DI lines. When the +DI line (dotted green) crosses above the -DI line (dotted red), that signals an uptrend. When the opposite happens — the +DI line (dotted green) crosses below the -DI line (dotted red) — that signals a downtrend. Look at the chart below for a clearer picture.
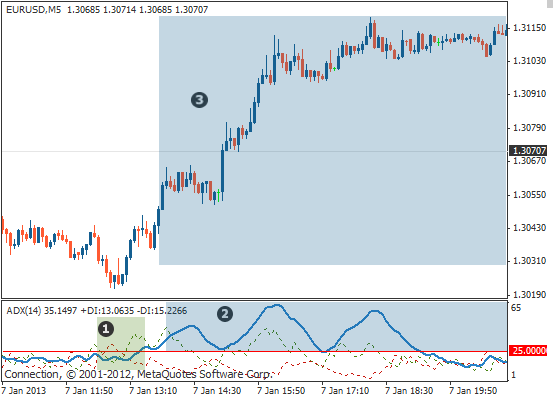
- In the chart above, notice that the +DI line crosses above the -DI line at point 1, signaling an uptrend. Notice the ADX line is above the 25 horizontal line at point 2, confirming the strength of this trend. Looking at the price movement, you can see it rose sharply at point 3.
ADX Settings Explained
The ADX indicator calculates its reading from a set number of the most recent candles on the chart. Setting the indicator to 8, for example, focuses it on the last 8 candles. The default setting for the ADX indicator is 14 periods, meaning it focuses on the last 14 periods.
You can of course change the settings to fit your trading style, but before doing that you should understand how changing the settings affects how the indicator works. Look at the chart below.
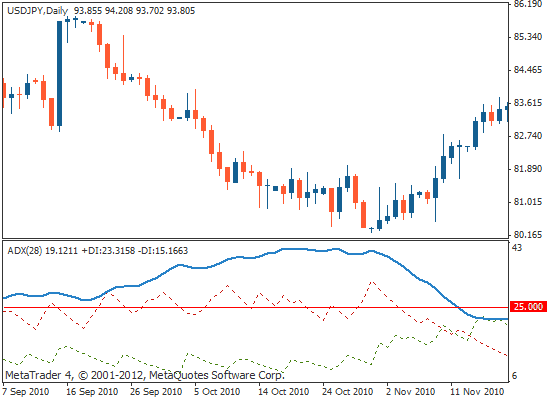

In the chart above, the ADX indicator was set to 28, as shown in the top-left corner above the indicator. Using a higher setting smooths out the average price movement that the ADX line displays, making the reading more reliable — but it also takes much longer for that reading to appear, meaning you miss a large part of the trend before getting a good signal.
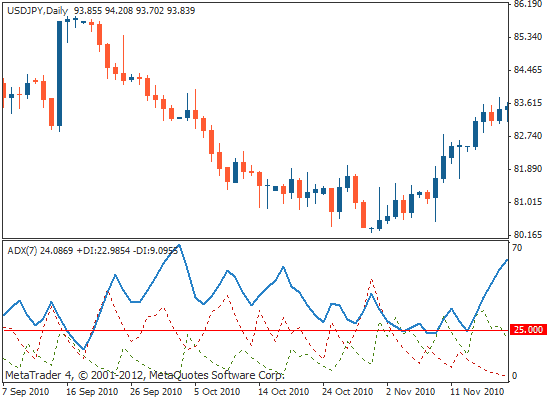
Using a lower setting, on the other hand, gives you a reading faster but can carry a lot of false signals, so low settings are less reliable than high settings. Look at the chart below for the ADX indicator set to 7, and compare it with the previous chart to get a full picture of how changing the settings affects how the indicator works.
Changing the Settings Doesn’t Affect the +DI and -DI Lines
Notice in the two charts above that changing the settings had very little effect on the +DI and -DI readings. For example, you can see that the indicator’s reading was the same in both cases, showing a downtrend, since the -DI line (dotted red) stayed above the +DI line (dotted green) — the result was the same in both cases: a downtrend.
From the above, it’s clear that if you change the ADX indicator’s settings, you should confirm the change is actually improving your trading results, not making them worse.
Conclusion
The ADX indicator determines whether a price trend is strong, which reduces risk and increases profit within a solid trading strategy, since it uses the average directional movement to determine when the price trend is strong — making it a precise trend indicator.
The basic rule for successful trading in any strategy is that the trend is your friend, and the ADX indicator certainly helps you recognize that friend. So here’s what you need to know about the ADX value as a trend-strength indicator:
- The ADX indicator is used mainly to measure the current strength of a trend.
- The ADX indicator consists of three lines: +DI, -DI, and ADX.
- The indicator’s reading ranges from 0 to 50: a reading below 25 signals a weak trend, a reading above 25 signals a strong trend, and a reading between 30 and 50 signals the trend is at its strongest.
- The default setting for the ADX indicator is 14, and traders typically choose settings between 7 and 30. The higher the setting, the smoother the price reading and the more reliable the signal, while lower settings detect a trend earlier but carry more false signals.
Read more:
- Best American stock trading companies
Test this indicator without risking capital
Reading about an indicator is not the same as watching it behave on a live chart. A demo account lets you apply the settings above to real market data and see how the signals form before any money is involved.
Advertising disclosure: partner link. Easy Trade may receive compensation. Educational content, not financial advice. CFDs carry a high risk of losing your capital.
Disclaimer: This article is for educational purposes only and does not constitute investment advice. Trading forex and CFDs involves leverage and carries a high risk of losing money quickly. This page may contain affiliate links, and we may earn a commission if you use them, at no extra cost to you.