
3 Trend Line Trading Strategies

The trend line is one of the easiest and strongest tools in technical analysis. If you can draw it correctly, it becomes an important addition to your trading toolkit — countless strategies are built around trend lines. In this article, I’ll share the three best trend line strategies you can use in trading.
How to Draw an Uptrend or Downtrend Line
First, keep in mind that how well this strategy works depends on drawing the trend line correctly. Two conditions must be met to draw a trend line:
- The trend line must rest on at least 3 points. You can always connect any two random points on your chart, but only once you have a third point are you dealing with a valid trend line.
- The trend line should be anchored to the candle body.
When drawing the trend line, it can cut through a candle’s wick, but it should not cut through the candle body.
Trend Line Strategies
1. Break and Retest
The break-and-retest strategy is very popular among traders because it’s simple. The idea is that once you identify a trend line, you wait for price to break through it and then retest the trend line again.
Sometimes price breaks away and doesn’t come back to retest. It’s better not to rush into a trade at that point.
One advantage of trend lines is that they give you clear stop-loss points — the stop-loss is generally placed below the trend line. Once that level is breached, the trade is considered invalid and shouldn’t be re-entered. In other words, the trend line acts as a buffer level between the entry price and the stop-loss.

The more points a trend line rests on, the more reliable it’s considered. In the chart below, the trend line rests on three points.
During the breakout, there was a lot of volatility in the market, but price quickly moved strongly higher.

Where to enter varies with the trader’s style. An aggressive, risk-seeking trader might enter a trade as soon as price retests the trend line. A more conservative trader waits until price moves further away from the trend line and shows momentum signals in the trade’s direction. This second approach can reduce the profit margin, but it may improve the trade’s reliability.
You can rely on quick entry signals such as Japanese candlestick patterns.
2. Trade With the Trend
The retest strategy explained above is a reversal-style strategy and a solid one that many traders follow. But what most traders focus on is trading in the direction of the trend.
In this strategy, you look for a clear trend in the market, wait for a correction, and then draw a trend line.
If you’ve already analyzed the prevailing trend and expect the downtrend to resume, you can enter directly after the trend line breaks, because you’ve already read the market and know this is just a correction — and because the prevailing trend is the direction you’re trading with. Look at the chart below.

In the chart above, notice that price was first in a downtrend but began correcting after a number of points. At that point we drew a trend line below the correction. Notice that after the trend line broke to the downside, price didn’t retest it — a good sell trade could have been taken as soon as the trend line broke downward.
Note
This correction pattern is usually called a flag pattern.
You can use the Fibonacci retracement tool to identify where the current correction ends — we covered that in an earlier article, available here.
You can also add a long-term moving average, such as the 50-period moving average, to the chart to identify the longer-term trend. Look at the chart below.

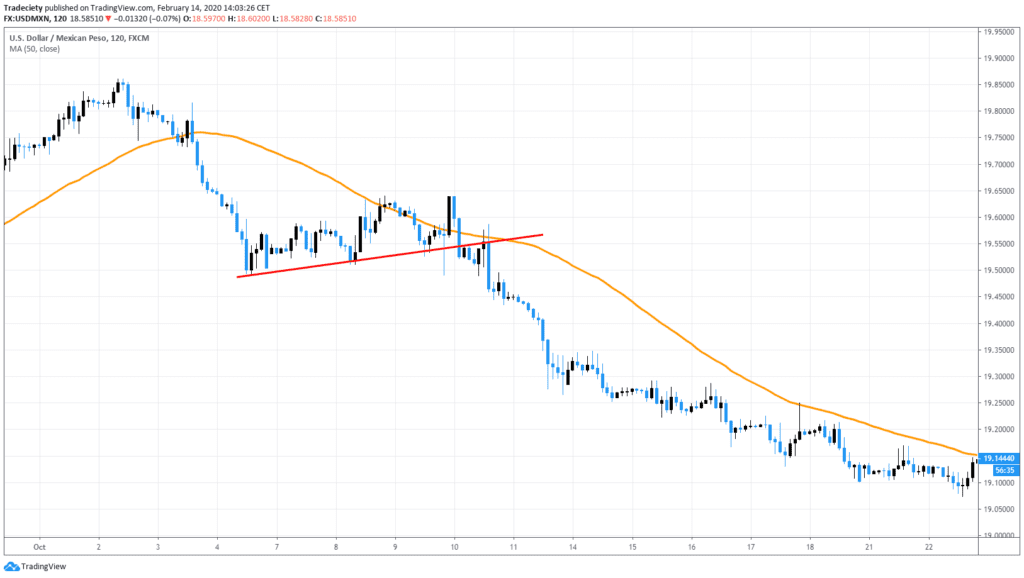
In the chart above we added the 50-period moving average. Notice that the indicator shows the prevailing trend is downward. Price then began to correct but resumed the downtrend as soon as it touched the 50-period moving average — at that point a trade could have been taken once the trend line broke to the downside.
As we defined earlier, the stop-loss sits above the trend line in a downtrend and below the trend line in an uptrend.
3. Bounce From the Trend Line
In this strategy, the trend line can be treated as a support and resistance line, because price may bounce off it.
Look at the chart below.

In the chart above, notice that price bounced off the trend line three times in a row, which confirms the trend line’s validity and strength.
After confirming the trend line’s strength, we need another signal before entering a trade in the uptrend direction. Notice that price formed a horizontal resistance level and bounced near it several times.
In this strategy, a trader can be more conservative and place the stop-loss right below the trend line, or place it below the resistance level.
Note,
There’s another way to trade the pattern above — it’s considered an ascending triangle pattern, and the full article on it is available here.
Trend line bounces can also be used in a multi-timeframe approach — draw a trend line on a higher timeframe to identify expected bounce zones, then move to a smaller timeframe and use any other trading tool. This is sometimes called combining trend lines with your own strategy.
Below, we’ll look at a trend line drawn on the higher timeframe.
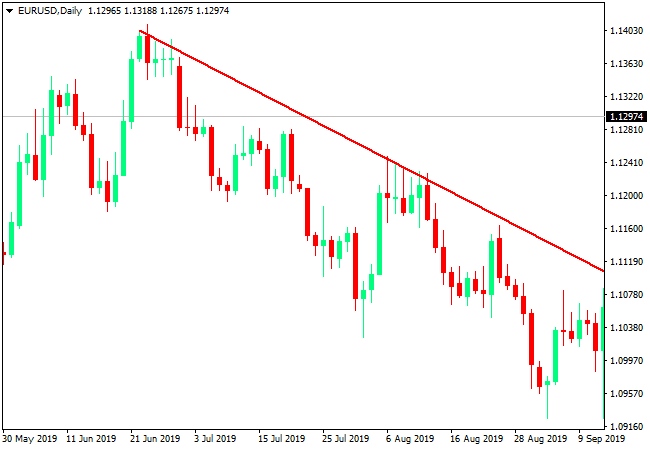
In the chart above, the trend was downward and a trend line was drawn on the daily timeframe. Opening the 4-hour timeframe, we found a descending triangle pattern had formed — look at the next chart.
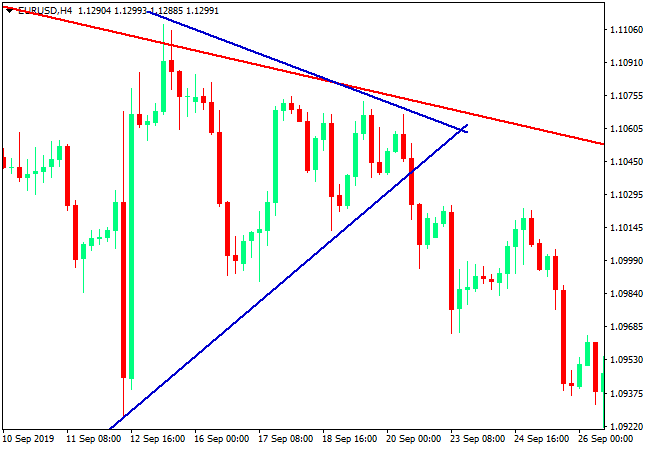
In the chart above, a sell trade could have been taken after this pattern broke.
Using a multi-timeframe approach can help some traders enter trades earlier, as well as spot other likely price-movement scenarios.
In addition to the above, you can also trade a trend line bounce directly on the higher timeframe without needing a smaller timeframe, provided another signal supports the expected move — such as Japanese candlestick patterns or a shift in momentum, among others.

Conclusion
A trend line is a line drawn on a chart to show the direction of the market in a trading context. Trend lines are drawn on price charts to show the direction of price, and traders use this information to decide whether they want to buy or sell in the direction of the trend.
Trend lines can also be used for stock prices, forex pairs, or cryptocurrencies — they’re among the most widely used price-action tools in technical analysis.
- The break-and-retest strategy is very popular and used by many traders.
- The break-and-retest strategy is a reversal-style strategy.
- The more points a trend line rests on, the more reliable it’s generally considered.
Try this strategy on a demo account first
A strategy that looks clear in an article can behave very differently under real spreads and volatility. Testing it on a demo account shows you how it performs before you commit any capital.
Advertising disclosure: partner link. Easy Trade may receive compensation. Educational content, not financial advice. CFDs carry a high risk of losing your capital.
FAQ
How do you draw support and resistance lines?
To draw a horizontal line on your chart, select the horizontal line tool on your toolbar and click anywhere on the chart where you want the line to appear. Horizontal lines are often used to mark support and resistance levels in the market, where price may struggle to break below or above.
What is a price channel?
A price channel refers to a pattern that appears on a chart when an asset’s price becomes confined between two parallel lines. A price channel can be described as horizontal, ascending, or descending depending on the direction of the trend.
What does a downtrend mean?
A downtrend is when price moves downward over a period of time, and it’s identified by prices forming lower lows and lower highs. A downtrend gives traders the opportunity to trade falling asset prices.
How do you draw trend lines?
To draw a trend line, look at the chart and draw a line that aligns with the current trend. When drawing trend lines, it’s best to be able to connect at least two highs or two lows. The more highs or lows the line connects, the stronger the trend line.
Disclaimer
This article is for educational purposes only and does not constitute investment advice. Trend line strategies illustrate a method of technical analysis; they do not guarantee any trading outcome, and past chart examples are not indicative of future results. Trading forex and CFDs carries a high level of risk and most retail investor accounts lose money. This page may contain affiliate links, and easytradeweb may earn a commission if you open an account through them, at no extra cost to you.