
The VIX Explained: What the Volatility Index Really Measures

The VIX is one of the most quoted numbers in financial media and one of the most consistently misdescribed. It is called the fear index, quoted in dollars, and assigned threshold bands that no exchange publishes.
Cboe, which calculates and publishes it, describes it as a measure of market expectations of near-term volatility conveyed by S&P 500 Index option prices. Every useful statement about the VIX follows from that sentence. The same exchange publishes the put call ratio, a separate measure built from traded option volume rather than from option prices.
What follows checks the commonly repeated figures against Cboe’s own published daily series, and replaces the invented threshold tables with the distribution that series actually shows.
Key takeaways
- The VIX is an index level, not a price. It is not quoted in dollars and there is no dollar amount attached to it.
- It measures what S&P 500 index options are priced for. It says nothing about direction, and nothing directly about currencies.
- The threshold bands published by explainer sites are conventions, not definitions. Cboe publishes no such bands.
- Measured across Cboe’s 9,240 daily closes from January 1990 to July 2026, the median close is 17.61 and 62.8 per cent of all closes sit below 20.
- The record intraday high is 89.53 on 24 October 2008. The record closing high is 82.69 on 16 March 2020. Widely published guides state neither correctly.
- The index itself cannot be bought. Every tradable product references VIX futures, whose price can differ substantially from the index.
- Because those products hold futures rather than the index, their value can erode while the index goes nowhere.
Table of contents
- What the VIX Actually Measures
- Where the Number Comes From
- The Distribution the Threshold Tables Leave Out
- The Record Highs, and the Numbers That Get Misquoted
- Why You Cannot Buy the VIX
- Contango, the Roll, and Why VIX Products Decay
- What the VIX Means for a Currency Trader
- Who This Is Not For
- Frequently Asked Questions
What the VIX Actually Measures
Cboe describes the VIX Index as a leading measure of market expectations of near-term volatility conveyed by S&P 500 Index option prices. Three things in that description are routinely lost.
The first is that it measures expectations rather than events. It reads what options are priced for, which is a statement about what participants are currently paying to hedge, not a record of what has happened or a forecast of what will. The same expectation is what the vega of an individual option responds to.
The second is that it is directionless. A rising VIX means larger moves are being priced, not that prices will fall. Large upward moves raise it too.
The third is that it is an index level. Writing the VIX with a currency symbol is a category error, and it appears in published guides frequently enough to be worth stating plainly.
The fear index nickname is a description of how it tends to behave, not of what it computes. It rises when hedging demand rises, and hedging demand usually rises when participants are worried, but the nickname is commentary rather than definition.
Where the Number Comes From
The input is the price of S&P 500 index options. When those options become more expensive relative to the index, the VIX rises; when they get cheaper, it falls.
That is the whole mechanism, and it explains the properties that confuse readers. The VIX can rise on a day the market rises, because option prices can increase for reasons unrelated to direction.
The underlying is the S&P 500 itself, so what moves that index is what ultimately feeds the readings. Our page on stock index trading covers how the index is constructed and what drives it.
It also explains why the VIX has no track record to evaluate in the way a forecast would. It is a current price reading, not a prediction that later proves right or wrong.
A useful comparison is with the indicators covered on our page about leading and lagging indicators. The VIX is derived from prices in a related market rather than from the price history of the thing being measured.
The Distribution the Threshold Tables Leave Out
Explainer pages commonly print a table of bands: calm below 15, elevated above 25, extreme above 30. Those numbers are conventions that have been copied between sites. Cboe defines no such bands.
The bands can be replaced with something checkable. Cboe publishes the full daily history of the index, and the table below is the distribution of every closing value in it, from 2 January 1990 to 30 July 2026, a total of 9,240 trading days.
| Measure | Closing level | What it means |
|---|---|---|
| 5th percentile | 11.44 | Only 5 per cent of days closed below this |
| 25th percentile | 13.98 | A quarter of days closed below this |
| Median | 17.61 | Half of all days closed above, half below |
| 75th percentile | 22.70 | A quarter of days closed above this |
| 90th percentile | 28.55 | One day in ten closed above this |
| 99th percentile | 46.72 | One day in a hundred closed above this |
| Record low close | 9.14 | 3 November 2017 |
| Record high close | 82.69 | 16 March 2020 |
Two figures from that series are worth holding onto. The median close is 17.61, and 62.8 per cent of all closes sit below 20.
That reframes the common claim that a VIX above 20 signals volatility. A level above 20 is not unusual; it describes roughly the upper third of the historical record.
The genuinely rare readings are much higher. Only 8 per cent of closes exceeded 30, and only 2.2 per cent exceeded 40.
The Record Highs, and the Numbers That Get Misquoted
Published guides disagree with each other and sometimes with themselves about the highest the VIX has been. One widely read broker guide gives the 2020 peak as 66 in one sentence and as 82 dollars in another, then calls 80.86 the previous 2008 high.
Cboe’s own daily series settles it, and the distinction that resolves the confusion is between an intraday high and a closing high.
The record intraday high is 89.53, reached on 24 October 2008. The record closing high is 82.69, set on 16 March 2020.
The 80.86 figure that circulates as a 2008 intraday record is neither. It is the highest close of 2008, recorded on 20 November, and it was later exceeded by the March 2020 close.
The gap between the two measures is not cosmetic. On 24 October 2008 the index reached 89.53 during the session and closed at 79.13, and the intraday peak of the March 2020 episode was 85.47 on 18 March, a day that closed at 76.45.
Anyone comparing a live intraday quote against a remembered closing record is comparing two different series, which is how a single article ends up carrying three inconsistent numbers.
Why You Cannot Buy the VIX
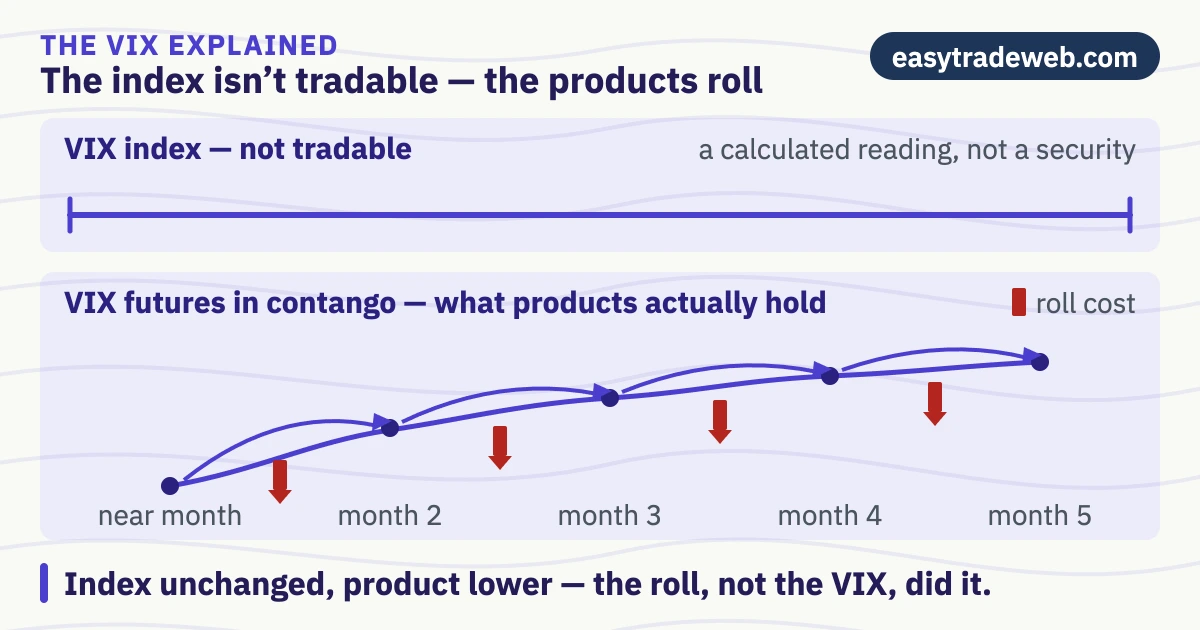
The VIX is a calculated statistic. There is no portfolio to hold that is the index, and no broker offers the index itself.
What exists are instruments that reference it. Cboe lists VIX futures and VIX options as the tradable products, and exchange-traded products are built on those futures rather than on the index.
This matters because the futures and the index are different numbers. A futures contract prices where the index is expected to be at its settlement date, so it can sit well above or below the level being quoted in the press.
A reader who sees the index rise sharply and then finds the product they hold has moved much less has not been misled by the broker. They are holding a different instrument, which behaves differently by construction. Our page on how futures differ from spot covers the general form of that gap.
Contango, the Roll, and Why VIX Products Decay
A product tracking futures cannot hold one contract forever, because contracts expire. It must sell the expiring contract and buy a later one, repeatedly.
When later-dated contracts are priced above nearer ones, a condition called contango, each of those switches sells something cheaper and buys something more expensive.
Repeated many times, that mechanical cost accumulates. A holder can be right that the index went nowhere over a period and still see the value of the product fall, because the cost is in the rolling rather than in the index. A separate mechanism opens a similar-looking gap in products that reset daily, where the drag comes from compounding off a new base rather than from replacing contracts.
The reverse arrangement, with later contracts priced below nearer ones, works in the holder’s favour, but it is the less common state in this market and it does not persist.
Guides that name contango without explaining this consequence leave out the single fact most likely to affect someone holding one of these products. It is the reason long-dated holding behaves so differently from the index chart it is named after.
What the VIX Means for a Currency Trader
The VIX is computed from S&P 500 index options. It is a measure of expected US equity volatility and it is not a measure of currency volatility.
Its relevance to a currency trader is indirect. It is a widely watched proxy for cross-asset risk appetite, and periods of sharply higher readings have tended to coincide with the broad risk-on and risk-off behaviour described on our page about intermarket relationships.
That relationship is a tendency observed across markets, not a rule, and it is subject to the same conditionality as every other intermarket relationship.
A trader wanting a measure of expected volatility in a specific currency pair should look at the implied volatility of options on that pair rather than at the VIX. The concept is covered on our page on implied volatility in options.
Reading the VIX as though it described EUR/USD is the most common misapplication of it on currency-focused sites, and it substitutes an equity measure for one that exists for the pair being traded. The same substitution happens with breadth readings, which count how many index members advanced and cannot be computed for a currency pair at all.
Who This Is Not For
This page will not produce entries. A VIX level describes what options are priced for at that moment and does not indicate direction or timing in any market.
It is also not a crash indicator. High readings have accompanied severe declines, but the index rises with expected movement of either sign, and the historical distribution above shows elevated readings are far more common than crashes.
Readers looking for a way to hold volatility should note that this page describes how the referenced instruments behave rather than recommending any of them, and the roll mechanics above are a reason for caution rather than a strategy.
Frequently Asked Questions
What is the VIX index?
The VIX is an index calculated and published by Cboe, which describes it as a measure of market expectations of near-term volatility conveyed by S&P 500 Index option prices. It is derived from what those options cost, so it reflects how much movement is currently being priced rather than what has already happened. It is an index level rather than a price, and it carries no direction.
Is a high VIX good or bad?
Neither by itself, because the index is directionless. A higher reading means larger moves are being priced in either direction. It is also worth knowing how common a given level is: across Cboe’s daily closes from 1990 to July 2026 the median is 17.61 and 62.8 per cent of closes are below 20, so a reading in the low twenties is ordinary rather than alarming.
Can I buy the VIX directly?
No. The index is a calculated statistic with no underlying portfolio to hold. Cboe lists VIX futures and VIX options as the tradable products, and exchange-traded products are built on those futures. Their prices reference expected future levels rather than the level being quoted, so they can move by a very different amount from the index over the same period.
Why do VIX ETFs lose value over time?
Because they hold futures that expire and must be replaced. When later-dated contracts are priced above nearer ones, each replacement sells a cheaper contract and buys a more expensive one, and repeating that has a cumulative cost. The value can therefore fall over a period in which the index itself is unchanged, since the cost arises from rolling the contracts rather than from the index level.
Does the VIX predict market crashes?
It is not a forecast. It is a current reading of what options are priced for, and it rises with expected movement in either direction. Cboe’s own history shows elevated readings are far more frequent than severe declines: 8 per cent of closes exceeded 30 while only 2.2 per cent exceeded 40. Treating a raised level as a crash signal misreads a price measurement as a prediction.
Sources checked 31 July 2026: Cboe Global Markets, VIX tradable products page, for the description of the VIX Index as a leading measure of market expectations of near-term volatility conveyed by S&P 500 Index option prices, and for VIX futures and VIX options being the products listed as tradable. Cboe Global Markets, published VIX daily price history covering 2 January 1990 to 30 July 2026, a series of 9,240 trading days, for the record intraday high of 89.53 on 24 October 2008; the record closing high of 82.69 on 16 March 2020; the highest close of 2008 at 80.86 on 20 November 2008; the record low close of 9.14 on 3 November 2017; the 24 October 2008 close of 79.13; the 18 March 2020 intraday high of 85.47 and its close of 76.45; and for every percentile in the distribution table. The percentiles, the median of 17.61, the mean, and the proportions of closes below 20 and above 30 and 40 were calculated directly from that published series rather than taken from any secondary source. Competitor figures identified as inconsistent are from CMC Markets, and the threshold-band table described as convention rather than definition is from CapTrader; both were read in full. Two of the five results surveyed could not be read, so the outline rather than a competitor word count governed the length of this page. One claim was investigated and deliberately omitted: the widely repeated account of a change in VIX methodology and of the earlier index surviving under another ticker could not be confirmed on any Cboe page reachable at the time of writing, so it does not appear here.
Disclaimer: This article is educational only, is not investment advice, and is not a recommendation to trade the VIX, any product referencing it, or any other instrument. Leveraged trading carries a high risk of losing money rapidly and losses can reach the full amount deposited. The historical distribution shown here describes what has already been recorded and does not indicate what the index will do next, and no level of the VIX indicates direction or timing in any market. Verify current data at Cboe and, if needed, seek independent advice.