
Williams %R Indicator: One Setting, and One Real Decision

Williams %R is usually introduced as an overbought and oversold oscillator, with a pair of thresholds and a default period attached. Nothing in that introduction is wrong. It simply omits what a trader most needs to settle before adding the indicator to a chart.
The line it draws is not new information. It is the fast stochastic, rescaled, and the platform you run it on decides how much of it you are allowed to change.
Key takeaways
- The indicator scores the latest close against the extremes of a look-back window, on a scale running from 0 down to -100. Larry Williams developed it.
- StockCharts documents it as the inverse of the fast stochastic oscillator, and states that the two produce identical lines separated only by their scaling. Running both is one reading counted twice.
- MetaTrader 5 exposes a single calculation parameter for it and five for the stochastic. That asymmetry is in the MQL5 reference, and it decides which published advice you can follow.
- TradingView adds a Source input that MetaTrader does not offer, so a setting recommended for one platform may not exist on the other.
- A reading resting against -100 through a trend is the window doing its job, not a reversal being signalled. The threshold pair stops discriminating exactly when a market trends.
Table of contents
- What Williams %R Measures, and the One Number It Needs
- Why MetaTrader Gives It One Setting and the Stochastic Five
- The Same Line at a Different Scale, and What That Costs You
- What a Reading Pinned at -100 Is Telling You
- Choosing the Look-Back Against the Pair You Trade
- Which Figures This Page Does Not State, and Why
- Who Should Not Add This Indicator
- Questions Readers Ask About Williams %R
What Williams %R Measures, and the One Number It Needs
The calculation asks a single question. Across a window of N bars, whereabouts in the span between its dearest and cheapest prints does the latest close fall?
A close equal to the highest high of the window scores at the top of the range, a close equal to the lowest low scores at the bottom, and everything else lands proportionally between them. The raw ratio is then multiplied so the scale runs from 0 down to -100, which is why every reading carries a minus sign.
That is the whole construction, and it needs exactly one input: how many bars the window covers. TradingView documents the default as 14, and describes the oscillation between 0 and -100 with values nearer zero corresponding to the upper end of the recent range.
What the number does not contain is any notion of speed or volume. Two windows with an identical closing position score identically whether the market crawled there or gapped there. The measure is positional, and reading it as momentum is the first place traders overreach with it.
Why MetaTrader Gives It One Setting and the Stochastic Five
Here the indicator parts company with the measure it is most often bracketed against, and the gap between them is documented by the platform rather than open to argument.
In the MQL5 reference, the function that returns a Williams %R handle takes the symbol, the timeframe and one further argument: the averaging period used for the calculation. The same reference states that the indicator has one buffer. There is nothing else to configure, and nothing else to plot.
The stochastic function in that same reference takes five arguments beyond symbol and timeframe: a %K period, a %D period, a slowing value, a method of averaging, and a price field. Each of those is a decision, and our page on the stochastic oscillator settings MetaTrader exposes works through what each position sets and what a 14-3-3 configuration actually means.
Two consequences follow, and neither is cosmetic. There is no second line to cross, so a crossover signal has no equivalent here. And there is no smoothing parameter, so a %R plot cannot be quietened the way a stochastic can.
Platform differences compound this. TradingView documents a Source input for its version, with the close as the default, so the price the calculation reads can be changed there. MetaTrader offers no such choice. Advice written against one of those platforms can therefore be unfollowable on the other, and published guidance rarely says which one it assumed.
The Same Line at a Different Scale, and What That Costs You
StockCharts describes Williams %R as the inverse of the fast stochastic oscillator, and states directly that the two indicators generate identical lines distinguished only by their scaling. The two constructions measure the closing position within the same high-low window and then express the result in opposite directions, which the multiplication by a negative factor reconciles.
The practical consequence deserves to be spelled out, because the popular write-ups of this indicator record the equivalence and then decline to draw anything from it. If a chart already carries a fast stochastic, adding Williams %R adds no independent reading. Two panes will move together, two sets of thresholds will trigger together, and a trader watching both will feel a confirmation that does not exist. One input has produced two displays.
So the choice is not which indicator is better. It is which scale is easier to read, and then running only that one. A trader who prefers a 0 to 100 range with a signal line available takes the stochastic. A trader who wants a single uncluttered line and does not need the crossover takes %R.
The widely circulated comparison sets Williams %R against the relative strength index instead, and that pairing is more informative because the two are built differently: one scores position inside a range, the other weighs gains against losses. Reading %R beside the ultimate oscillator gives a second opinion in a way a stochastic cannot.
What a Reading Pinned at -100 Is Telling You

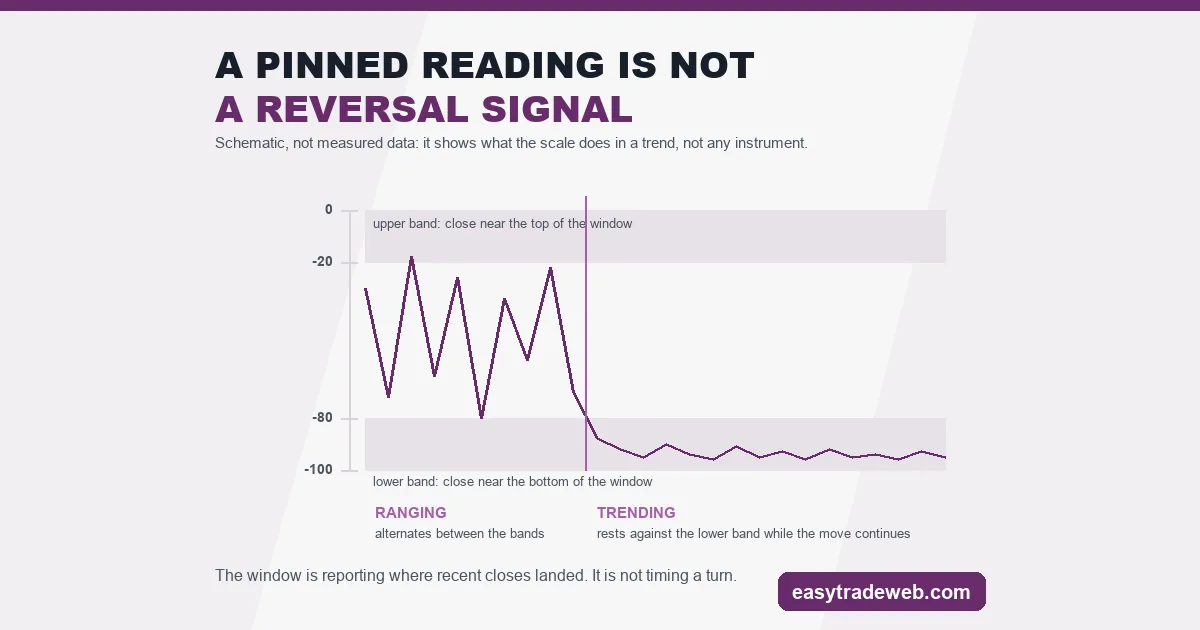
The conventional bands place the upper region between 0 and -20 and the lower region between -80 and -100. Those levels describe where the close sits in the window, and nothing more.
In a trending market the close repeatedly finishes near one extreme of its recent range, which is what a trend is. The indicator then sits against its boundary for long stretches. Nothing has malfunctioned: the window is accurately reporting where recent closes landed.
Treating that state as a reversal signal inverts the information. A reading against -100 says selling has been persistent, not that it is finished. This is the ordinary failure of every bounded oscillator, and our page on overbought and oversold levels covers why a bounded reading cannot by itself carry a timing decision.
The extremes are better suited to describing a regime. A plot alternating between its bands characterises a range; one parked in a band characterises a trend. That distinction is readable from the shape of the line without any threshold being crossed.
Choosing the Look-Back Against the Pair You Trade
With only one parameter, the look-back carries every choice the indicator permits. It sets the width of the high-low window, and therefore how often the close can reach an edge of it.
A short window is reached often. Extremes arrive frequently and mean little individually. A long window is reached rarely, and a reading at its boundary describes a genuine positional extreme over a longer record, at the cost of registering it later.
The 14 shipped as the TradingView default is a convention, not a derived value, and no issuer publishes a figure tuned to a currency pair or timeframe. Fix the period against the chart you actually trade: check how often the plot reaches its bands on that instrument across a meaningful stretch of history, and adjust until that frequency matches the occasions you would act on.
Because the indicator has no smoothing, that period is the only lever available for it. Where a stochastic can be calmed by raising its slowing value, a %R plot can only be calmed by lengthening the window.
Which Figures This Page Does Not State, and Why
No threshold appears here as a recommended setting, and no period is named as a best one, because no issuer publishes either. Platform defaults are defaults, not findings, and a number repeated across many articles without a source behind it does not become sourced by repetition.
No claim is made about how often an extreme reading precedes a turn. That would need a stated market, period and method, and none of the material read for this page supplies all three.
The construction, the scale, the parameter counts and the relationship to the fast stochastic are all documented by the platforms that implement the indicator, and those are what this page states.
Who Should Not Add This Indicator
A trader already running a fast stochastic gains nothing here, and this page has no reason to persuade them otherwise. The correct action in that case is to change nothing.
A trader looking for a crossover signal is also in the wrong place. There is no second line to cross in the MetaTrader implementation, so any method requiring one has to be built on a different measure.
Where it earns its place is a chart that carries no range-position measure at all and wants one uncluttered line for it, read as a description of where price sits rather than as an instruction. Set the window against the instrument, read the bands as a regime description, and pair it with something built differently when a second opinion is needed. Our technical indicators guide sets out how the families differ.
Questions Readers Ask About Williams %R
What does Williams %R actually measure?
It measures whereabouts the latest close falls within the extremes of a look-back window. A close at the top of that window scores near 0 and a close at the bottom scores near -100, with everything else falling proportionally between them. It carries no information about speed or volume, only about position inside the recent range.
What period should Williams %R be set to?
TradingView ships 14 as the default length, and no issuer publishes a period tuned to any particular instrument. The period sets how wide the high-low window is, so a shorter one reaches its extremes often and a longer one reaches them rarely. Fix it against the chart you trade by checking how frequently the plot reaches its bands over a meaningful stretch of history.
Is Williams %R the same as the stochastic oscillator?
StockCharts documents it as the inverse of the fast stochastic and states that the two produce identical lines separated only by scaling. So they are the same reading shown two ways rather than two independent measures. Running both on one chart displays a single input twice, which can read as confirmation when none exists.
Does a reading of -90 mean the market will turn?
No. A reading near -100 reports that recent closes have finished near the bottom of the look-back window, which is what a downtrend produces. The measure can rest against that boundary for long stretches while a trend continues. It describes position, not timing, and a bounded reading alone does not carry a reversal signal.
Risk warning: this page is educational and explains how a technical indicator is constructed and what it can and cannot show. It is not advice to buy or sell any instrument, it recommends no product, platform or broker, and nothing here is a signal, a performance claim or a prediction. Past or simulated performance figures do not indicate future results, and leveraged trading carries a high risk of losing money.