
Evening Star Candlestick Pattern

The evening star is a Japanese candlestick pattern on a price chart that technical analysts use to spot when a trend may be about to reverse. It is a bearish pattern made up of three candles: the first is a large bullish candle, the second is a small-bodied candle, and the third is a bearish candle.
Read more: Learn about the most well-known Japanese candlestick patterns.
The evening star forms at the top of an upward price move, which signals that the uptrend is nearing its end.
Key Points on the Evening Star Pattern
- The evening star is a candlestick pattern that technical analysts use to anticipate future price reversals toward a downtrend.
- Even though this pattern occurs rarely, traders treat it as a useful technical signal.
- The evening star is the opposite of the morning star pattern — the two act as bearish and bullish signals respectively.
Trading the Evening Star Pattern
The evening star pattern is a way of presenting specific information about an asset with certainty. Specifically, it shows the opening price, the high, the low, and the closing price of the asset over a given period.
Each candle in the pattern is made up of a body and two wicks, where the length of the body is a function of the range between the high and low prices during the trading session. A long bullish candle points to a sizeable price move, while the shorter second candle points to a smaller price change, and the third bearish candle confirms the trend reversal. In other words, long candle bodies point to heavy buying or selling pressure depending on direction, while short candles point to limited price movement.
Many technical analysts treat the evening star as a signal that a decline may follow in the near term. Its pattern forms across three candles:
- The first candle is a large bullish candle that shows prices continuing to rise.
- The second candle is smaller and shows a modest increase in price.
- The third candle is a large bearish candle that opens lower than the previous day and closes near the midpoint of the first candle.
Special Considerations for the Evening Star Pattern

Traders often use the evening star as a signal that a downtrend may be starting, though it can be hard to identify amid the noise in stock price data. To help confirm it, traders often use price oscillators and trend lines alongside the pattern.
Despite its popularity among traders, the evening star is not the only bearish signal in Japanese candlesticks. Other bearish candlestick patterns include the bearish harami, the dark cloud cover, the shooting star, and the bearish engulfing pattern. Different traders have their own preferences for which patterns they watch when looking to spot trend changes and reversals. The chart below shows an example of the evening star pattern:
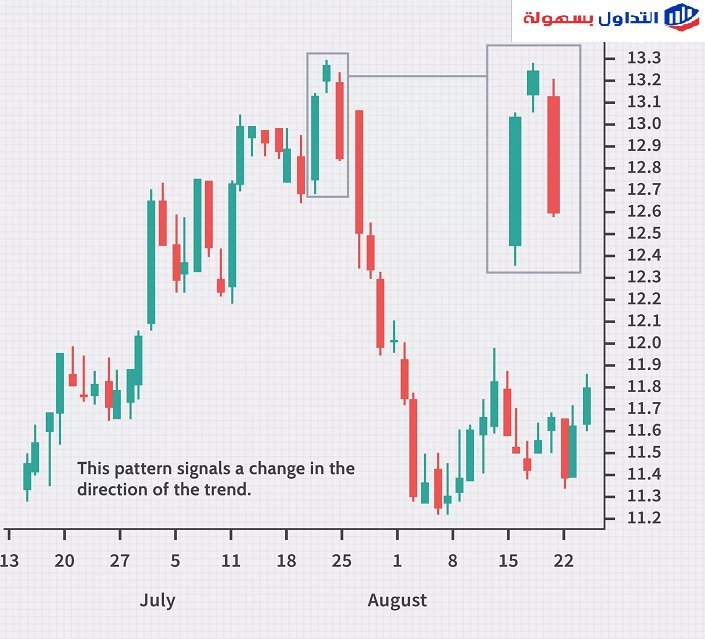
In the chart, the three candles shown start with a long bullish candle that reflects rising prices from strong buying pressure. The second candle also shows a price increase, but the size of the gain is modest compared with the previous candle. Finally, the third bearish candle is long, with selling pressure forcing the price back down near the midpoint of the first candle.
These are the warning signs of an evening star forming. Technical analysts who trade these patterns might consider short-selling assets in anticipation of a possible decline.
Finally, the evening star pattern forms at the top of an upward price trend and signals that the uptrend may be nearing its end. The opposite of the evening star is the morning star pattern, which is generally treated as a signal of a possible move upward following a downtrend.
Read more:
- Best types of Japanese candlesticks
- Japanese candlestick patterns: the 14 most common reversal patterns
- A guide to the best 9 patterns for mastering Japanese candlesticks in trading
Test this indicator without risking capital
Reading about an indicator is not the same as watching it behave on a live chart. A demo account lets you apply the settings above to real market data and see how the signals form before any money is involved.
Advertising disclosure: partner link. Easy Trade may receive compensation. Educational content, not financial advice. CFDs carry a high risk of losing your capital.
Disclaimer: This article is for educational purposes only and does not constitute investment advice or a recommendation to trade any specific asset. Candlestick patterns like the evening star describe past price action and can fail to predict future moves, so they should be used alongside other analysis, not on their own. Trading forex and CFDs involves leverage and carries a high risk of losing money quickly. This page may contain affiliate links; if you open an account through one of them, Easy Trade Web may earn a commission at no extra cost to you.