
What Is the Shooting Star Pattern?

The shooting star is a bearish candle with a long upper shadow and a small or non-existent lower shadow, and a small real body positioned near the previous candle’s close on the same timeframe. It appears after an uptrend. Another form of the pattern occurs when the candle opens with a price gap and then closes back near its own opening price.
For a shooting star to count as valid and complete, the pattern candle must form while price is still advancing higher. The distance between the candle’s high and its opening price must be at least twice the size of the shooting star’s body, and there should be little to no shadow below the real body.
Key Takeaways for the Shooting Star Pattern
The shooting star, one of the strongest Japanese candlestick patterns, forms after a rise and signals that price may start to fall.
The pattern is bearish because price tried to push notably higher during the candle on a given timeframe, but sellers then took control and pushed price back down toward the open.
Traders usually wait to see what the next candle after the bearish shooting star does. If price falls during that next candle, they may look to sell or go short.
If price rises after the shooting star candle, the pattern may be a false signal, or the candle may simply mark a potential resistance zone around its price range.
Read also: Evening Star pattern
What the Shooting Star Pattern Tells You
The bearish shooting star points to a possible top and price reversal. It works best when it forms after a series of three or more consecutive rising candles with successively higher highs. It can also appear during a general price advance even if some of the most recent candles were bearish.
After a strong advance, the shooting star forms and price then pushes up sharply, showing the same buying pressure seen over the previous periods. But sellers step in and drive price back down near the open, wiping out the advance. This shows that buyers lost control by the end of that candle’s period on the given timeframe, and sellers may now be in control of price.
The long upper shadow of the shooting star represents buyers who bought during the candle’s period but are now under pressure because price has dropped back to the opening level.
To confirm the pattern, the candle that forms after the shooting star usually confirms the downside potential: the next candle’s high should stay below the shooting star’s high, and it should then close below the pattern candle’s close.
Ideally, the candle following the shooting star falls or opens near the shooting star’s close and then moves down strongly. A confirmation candle like this helps confirm the price reversal and suggests price may keep falling over the medium to long term, and traders may look to sell or go short.
But if price rises in the candle following the bearish shooting star, the shooting star’s price range may still act as a resistance zone.
For example, price may stall within the shooting star’s range, forming a sideways move. If price ultimately keeps rising, the uptrend remains intact, and traders should favor long positions over selling or going short unless price breaks below the shooting star’s range. The chart below shows an example of how the shooting star is used.
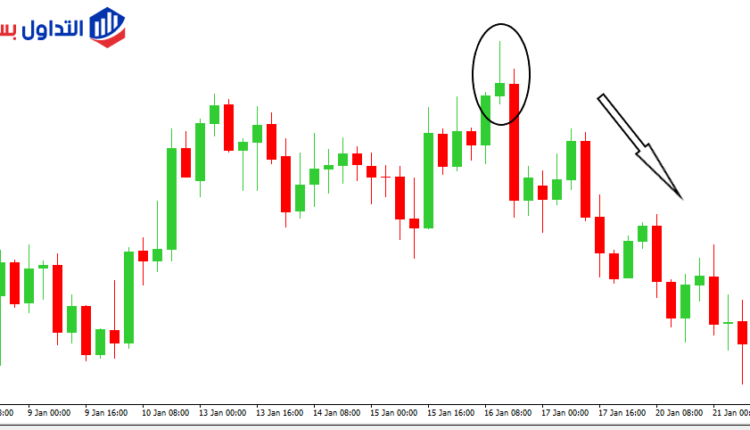
In the example, the asset rises in a strong uptrend before the shooting star forms. The bearish shooting star then appears: price opens higher than the previous candle, the upper shadow extends higher, and price then closes near the opening level, forming the shooting star’s small body.
Confirmation then follows: the next candle closes below the shooting star’s range, helping confirm the potential downward price move.
The shooting star’s high is not breached, and price moves lower over the following periods, as shown in the chart. When trading this pattern, a trader can sell the asset and close open buy positions once the confirmation candle is complete, as seen in the chart.
Read also: Morning Star pattern

Shooting Star vs. Inverted Hammer: The Difference
The inverted hammer and the shooting star look exactly the same: both have long upper shadows and small real bodies near the bottom of the candle, with little to no lower shadow.
The difference is where they form. The shooting star forms after a price rise and marks a possible turning point to the downside, while the inverted hammer forms after a price decline and marks a possible turning point to the upside.
Read also: Inverted Hammer pattern
Limitations of the Shooting Star Pattern
It is a single candle that forms within a strong prevailing uptrend and works to turn prices lower. Because sellers only take control for part of one candle, as with the bearish shooting star, the pattern may not carry much weight until it is confirmed by a bearish candle after it, before deciding to open a trade.
This is why confirmation is required and important for the pattern to be complete: selling should happen after the bearish shooting star candle. And even with confirmation, there is no guarantee price will keep falling, or by how much. Price can resume rising after a short bearish correction, in line with the longer-term uptrend.
So when using this pattern in your trading strategy, use stop-loss orders with Japanese candlesticks — if you don’t define your risk, it won’t be controlled. You should also consider using candlestick patterns alongside other forms of analysis, such as indicators, support and resistance, and Fibonacci levels. Only then does the shooting star gain more weight, when it occurs near a level already considered significant by other forms of technical analysis.
Finally, in technical analysis, the shooting star is read as a type of reversal pattern that warns of falling prices. The shooting star looks exactly like the inverted hammer, but the inverted hammer points to an upward move, so the two carry different implications. The shooting star’s candle has a small lower body, little to no lower wick, and a long upper wick that is at least twice the size of the lower part of the body.
Read also: Japanese candlestick patterns | The 14 most common reversal patterns
Test this indicator without risking capital
Reading about an indicator is not the same as watching it behave on a live chart. A demo account lets you apply the settings above to real market data and see how the signals form before any money is involved.
Advertising disclosure: partner link. Easy Trade may receive compensation. Educational content, not financial advice. CFDs carry a high risk of losing your capital.
Frequently Asked Questions
How do candlesticks form?
Japanese candlesticks are made up of three main components: the body, which shows the difference between the opening and closing price; the wick, which shows the price’s deviation; and the color, which shows whether the candle is bullish or bearish.
How many candlestick patterns are there?
There is a large number of Japanese candlestick patterns, but the most well-known ones number 12, split between continuation patterns and reversal patterns.
What year do Japanese candlesticks date back to?
Japanese candlesticks date back to the year 1600, emerging thanks to the rice trade. Their true refinement, however, came from the trader Munehisa Homma, who was born in 1724 and died in 1803.
Disclaimer
This article is for educational purposes only and does not constitute investment advice. The shooting star and other candlestick patterns are tools for reading price action; they do not guarantee future price direction, and any signal can fail or need confirmation that never arrives. Trading forex and CFDs involves leverage and carries a high level of risk to your capital. Some links on this site are affiliate or sponsored links, through which we may earn a commission at no extra cost to you.