
Oscillator Strategy Explained

The oscillator strategy is one of the more useful indicators traders combine with other trading methods, because it helps pinpoint entry points. In this article we look at an oscillator strategy you can rely on for scalping trades.
What is the oscillator strategy
The word oscillator refers to fluctuation, and here it means specifically the oscillator indicators available on the MetaTrader platform. From these, we use the Relative Strength Index (RSI) in particular.
Read also: Parabolic SAR and moving average strategy
Strategy requirements
The oscillator strategy does not need many complex tools that could confuse the trader. All we need are two technical indicators, one trend indicator and one oscillator:
- 200 Simple Moving Average
- Relative Strength Index (RSI)
Most traders already know these indicators; they are on the MetaTrader platform and need no download or installation.
This strategy relies mainly on short-term or scalping trades, so large timeframes are not preferred. You can use timeframes from the 1-minute up to the 15-minute. We will apply the explanation on the 15-minute timeframe.
Strategy rules
To keep the explanation clear, we will break the strategy rules into simple steps as follows:
1- Trade during active market hours
The strategy may not work well when the market is quieter, such as the Asian session or the periods before important economic data. On the other hand, it is more effective during active market periods, which usually start with the European session and the overlap between the American and European sessions, with some activity before the American session closes. So the best trading hours for this strategy run from the European market open to the American market close.
Read also: The best forex market activity hours
2- Preparing the chart
Here we set up the chart by adding the indicators mentioned above. Note the following image.
In the previous image, note that we added the RSI to identify the best entry points and an indicator on the 200 moving average to identify the trend.
3- Determining the trend

After preparing the tools we need for the strategy, the first step now is to identify the market direction clearly. We rely on the 200 moving average for this. Note the following image.
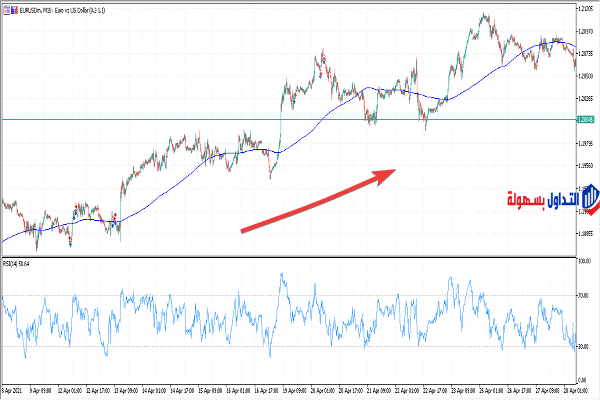
As you can see in the previous image, the 200 moving average was moving below price, which means the trend is up. If price moves below the moving average, that points to a downtrend. We will now look for buy trades on the RSI, which leads us to the next step.
Entering buy trades
Now we come to the most important part of the oscillator strategy, the entry points. What we need here is to draw a trendline on the RSI and wait for it to break upward for buy trades, or downward for sell trades. Note the following image to make the picture clearer.
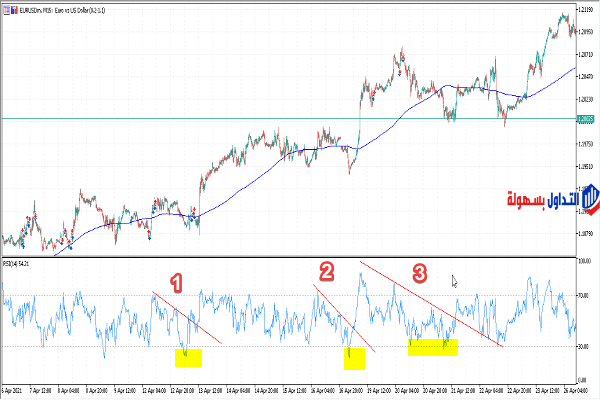
You can see in the previous image that three opportunities formed that could have been used. But remember, you should not enter buy trades until price leaves an oversold condition, as shown on the chart. A retest of the trendline can happen, as in the third trade, but there should be no break to the downside.
4- Setting the stop loss and take profit
As mentioned above, our strategy relies mainly on short-term trades, so the take-profit will not be large, preferably no more than 10 pips. For the stop loss, it goes below a low formed on the chart. The trade is secured once price moves toward the target by 50%, that is 5 pips or more. Note the following image.
As you can see in the previous image, all targets were reached in this example, and price corrected right after reaching the target. Remember that outcomes vary and signals can fail.
Finally, the oscillator strategy is a chart similar to the MACD indicator, but it shows market momentum for a recent number of periods compared with the momentum of a larger number of earlier periods.
If you want to study this further, you can look at the oscillator strategy alongside the MACD trend. It is simple to learn and follows the overall market direction.
Read also: Full explanation of the false breakout strategy
Read also: The easiest currency trading strategy
Read also: Forex strategy: moving average crossover
Try this strategy on a demo account first
A strategy that looks clear in an article can behave very differently under real spreads and volatility. Testing it on a demo account shows you how it performs before you commit any capital.
Advertising disclosure: partner link. Easy Trade may receive compensation. Educational content, not financial advice. CFDs carry a high risk of losing your capital.
Risk disclaimer
This article is for educational purposes only and is not investment advice or a recommendation to trade. Trading forex and CFDs uses leverage and carries a high risk of losing money rapidly; you can lose more than your initial deposit. Past performance and chart examples do not guarantee future results, and any trading signal can fail. Do your own research and only risk capital you can afford to lose. Some links on this site may be affiliate links, and we may earn a commission at no extra cost to you.