
What Are Hollow Candles

Traders have used Japanese candlestick patterns for years to display the price data of underlying assets on charts. There are two kinds of candles: hollow candles and filled candles. A hollow candle shows that price rose after the open, while a filled candle shows that price moved down after the open. Related reading: TickerChart.
Candlesticks also tell us about the strength of a trend in the market. Hollow candles tell us the trend is strengthening as price rises after the open, and filled candles tell us the trend is weakening as price falls after the open. This is very important information for traders who want to analyze the market and trade forex.
The Shape of a Hollow Candle
Every candle has a body that tells traders whether the market is up, down, or sideways, and its appearance reflects the price movement over the day. Traders can read all of this information from the shape of the candle, and hollow candles carry useful information through their appearance too.
A long hollow body shows that price moved noticeably higher in a single trading day, and it tells us that buying pressure was enough to push the candle up.
The Wicks of a Hollow Candle
The shadows of hollow candles, also known as wicks, show how far price moved away from the open and close. The wicks of hollow candles can mean different things, such as:
- A hollow candle with a long upper shadow points to bearish tendencies in the market and tells traders there is very little support at the higher level.
- A hollow candle with a short upper shadow points to an uptrend in the market and tells traders the high was close to the close.
- A hollow candle with no upper shadow points to a very strong uptrend in the market, because price moved higher throughout the day and closed at the very top.
- A hollow candle with a small lower shadow means price moved down slightly but then rose above the open and closed at a higher level, which is a sign of an uptrend in the market.
- A hollow candle with a long lower shadow also points to an uptrend that forms when price drops noticeably during the day, but after buying pressure, price rises above the open.
Color and Fill in Hollow Candles Show Price Behavior
When a candle is filled, it means the current close is lower than the open in the same time period. When a candle is hollow, it means the current close is higher than the open in the same time period. The color of the candle compares the current close with the close of the previous candle, so:
- Green candles mean the current close is higher than the close of the previous candle.
- Red candles mean the current close is lower than the close of the previous candle.
This is how hollow and filled candles usually look:
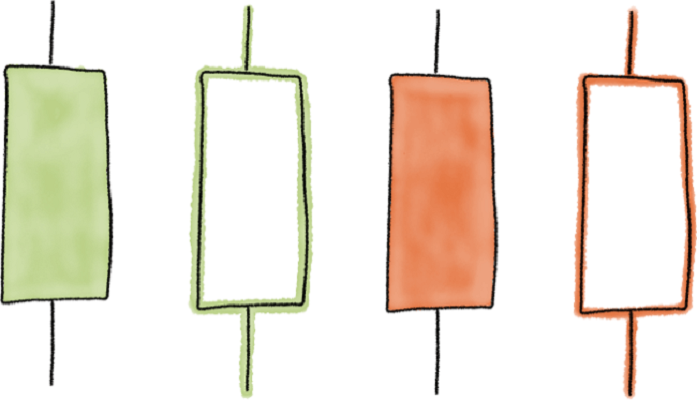
There is a lot of confusion when people ask about the difference between a filled and a hollow candlestick, because the question itself makes you think you are comparing hollow or filled candles with a traditional candlestick chart where all candles are filled.
But traditional candlestick charts are all filled and behave completely differently from the filled candles on a hollow candlestick chart. Next we will take a fresh look at hollow candlestick charts to understand how they work:
The hollow or filled attribute on these candles serves the purpose of showing whether the current close of the candle is higher or lower than the open in the same time period. Let us set color aside for now and look only at whether the candle is filled or not:

If the candle is hollow like the one above, it means the current close of the candle is higher than the open of the candle, so we can consider it a bullish candle.
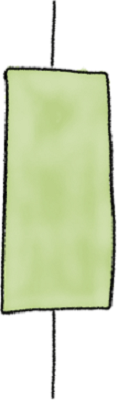
Now here is where it gets tricky. The candle above, which looks exactly like the standard candle we saw before, means something completely different when it is filled. In this case it tells us the current close is lower than the open of the candle.
On hollow candlestick charts, the color attribute of the candle is set by comparing the current close of the candle with the close of the previous candle. Next we look at an example:
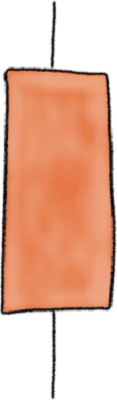
A red candle, regardless of whether it is hollow or not, means the close is lower than the close of the previous candle.

A green candle, regardless of whether it is hollow or not, means the close is higher than the close of the previous candle. Below are examples of reading hollow candles, where you will see clear cases and what each one tells us:
Example 1
Example 2
Example 3
Example 4
Conclusion
Hollow candlesticks give you a new way to see more information on a trading chart and to recognize when an uptrend or downtrend is forming, based on a mix of hollow and filled candles. The more information you have when you trade, the more context you have for your trading decisions.
The most important thing here is not to confuse hollow candlesticks with traditional candlestick charts, because we now understand they behave differently.
We should also note that charting tools vary a great deal across trading platforms. The same green candle, hollow or not, can appear black, while a red candlestick keeps its color. It is very important to check the differences in your own chart settings before you start trading.
Put the theory into practice
Concepts become far easier to understand once you see them on a live chart. A demo account gives you real market data with no capital at risk while you build familiarity.
Advertising disclosure: partner link. Easy Trade may receive compensation. Educational content, not financial advice. CFDs carry a high risk of losing your capital.
Frequently Asked Questions
Can you rely on Japanese candlesticks in trading?
No. Japanese candlesticks are one tool of technical analysis, and relying on them alone, without other analysis tools or factors, can lead to wrong trading decisions.
Can you rely on Japanese candlesticks for prediction?
No, because Japanese candlesticks are one form of technical analysis. There are other factors and patterns a trader should look at and use alongside Japanese candlesticks for a sound forecast.
What are the types of Japanese candlesticks?
Japanese candlestick patterns are formations that appear on trading charts and come in many varieties. Technical traders believe you can use them to estimate future price movement, which makes them useful for finding possible new opportunities. In technical analysis, the single factor you consider when studying the market is the price chart.
What do the tails mean in Japanese candlesticks?
On a candlestick chart, the high value in the data set is represented by the top of the wick or upper shadow. The low value in the data set is represented by the bottom of the tail or lower shadow.