
Bollinger Bands Indicator: Key Strengths for Forex Traders

Bollinger Bands is a standard indicator invented by John Bollinger. It shows the direction of price movement and consists of only two bands — an upper band and a lower band — that move above and below a moving average in the middle.
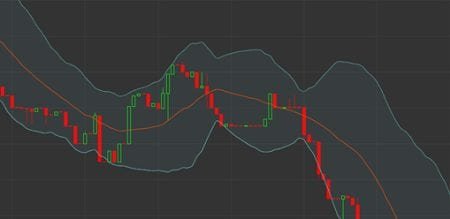
The following three topics matter for Bollinger Bands: how Bollinger Bands are builttrading signals strengths of Bollinger Bands
How the Best Bollinger Bands Settings Are Built
Bollinger Bands are mostly based on a 20-day (period) moving average, with the moving average running between the two bands.
Standard deviation is a statistical term that measures how much closing prices differ from the average closing price. The upper band is set two standard deviations above the 20-period moving average, and the lower band is plotted two standard deviations below the 20-period moving average.
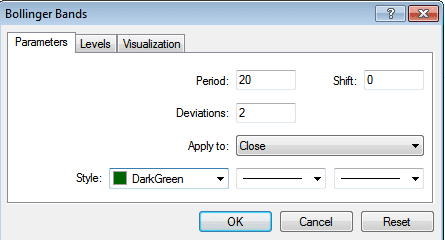
So the 20-period Bollinger Bands tell a trader how wide the range of closing prices has been over the last twenty periods, and therefore how volatile the market is. When the price is volatile, the bands will be wider; when the price is relatively stable, the bands will be narrower.
Bollinger Bands Indicator for Trading
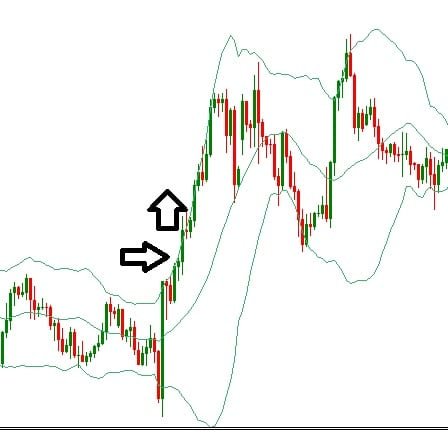

Bollinger Bands offer useful breakout signals for stocks or CFDs.
Entry signal — when the bands widen and start moving in opposite directions after a period of a strong rally or a strong drop, you can enter the trade in the direction the price is moving within the band.
Exit signal — you should set a stop loss in case the price reverses, whether classically below the nearest low or above the nearest high.
Strengths of the Bollinger Bands Indicator
- Helps you identify the trend direction
- Identifies current market volatility
- Support levels (the lower band) and resistance levels (the upper band).
Weaknesses of Bollinger Bands - The data used to calculate Bollinger Bands is historical and cannot predict the future.
Finally, the Bollinger Bands indicator has several uses, including overbought and oversold trading signals, and traders can also add multiple bands, which helps highlight the strength of price moves.
Another way to use the Bollinger Bands indicator is to watch for price squeezes during low volatility. These squeezes are usually followed by large price breakouts, ideally on high volume.
Test this indicator without risking capital
Reading about an indicator is not the same as watching it behave on a live chart. A demo account lets you apply the settings above to real market data and see how the signals form before any money is involved.
Advertising disclosure: partner link. Easy Trade may receive compensation. Educational content, not financial advice. CFDs carry a high risk of losing your capital.
Disclaimer: This article is for educational purposes only and does not constitute investment advice. Trading CFDs and forex carries a high level of risk and may not be suitable for all investors — you could lose more than your initial deposit. Technical indicators, including Bollinger Bands, describe past price behavior and do not guarantee future results; signals can fail. This page may contain affiliate links, and Easy Trade may earn a commission if you open an account through one of them, at no extra cost to you.