
Most Used Technical Indicators in Forex

Your trading knowledge comes down to knowing the strongest technical indicators and using the right tool at the right time to make informed decisions. Below we look at each of these tools separately, covering some of the most popular forex indicators. Not all of them measure price: the Aroon indicator reports how long ago the window’s extreme happened, and nothing about how far price travelled to get there.
Test this indicator without risking capital
Reading about an indicator is not the same as watching it behave on a live chart. A demo account lets you apply the settings above to real market data and see how the signals form before any money is involved.
Advertising disclosure: partner link. Easy Trade may receive compensation. Educational content, not financial advice. CFDs carry a high risk of losing your capital.
Bollinger Bands: One of the Strongest Technical Indicators
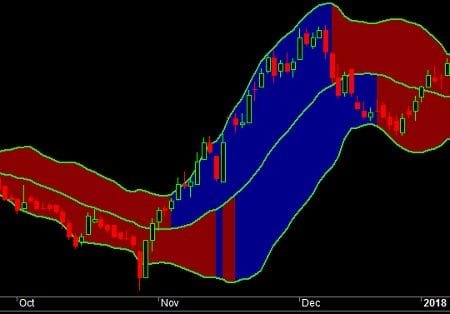
Bollinger Bands are used to measure market volatility and act as scaled-down levels of support and resistance. You can read more about the strengths of the Bollinger Bands indicator.
MACD: One of the Strongest Technical Indicators

MACD is used to spot trends early, and it can help you see a trend reversal. It is made up of two moving averages (fast and slow) and vertical bars called a histogram, which measures the distance between the two moving averages. One way to use MACD is to wait until the fast line crosses the slow line from above or below, since this signals the possible start of a new trend.
Read also: What Are Technical Indicators | The Best 7 Indicators That Will Help You Trade
Strongest Technical Indicators | Parabolic SAR
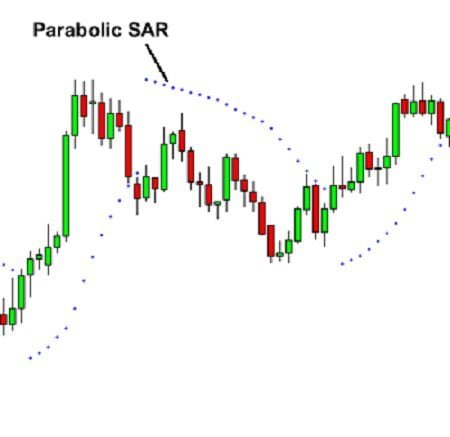
This indicator is designed to detect trend reversal points; SAR stands for Stop and Reversal. It is the easiest indicator to interpret since it only generates bullish and bearish signals. If the dots are above the candles, that is a sell signal. If the dots are below the candles, that is a buy signal. This indicator works best when the market has a long-term trend.
Strongest Technical Indicators | Stochastic
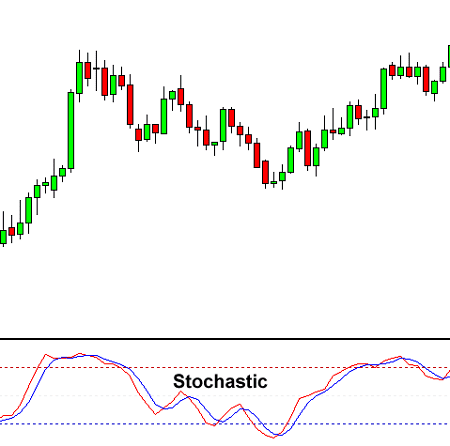
The Stochastic Oscillator is used to identify overbought and oversold conditions. When the moving average lines are above 80, the market is in overbought territory and traders look to sell. A three-line version of it is also common, and the KDJ indicator covers what its extra line measures.
When the moving average lines are below 20, the market is in oversold territory, and traders look to buy.
Strongest Technical Indicators | Relative Strength Index (RSI)
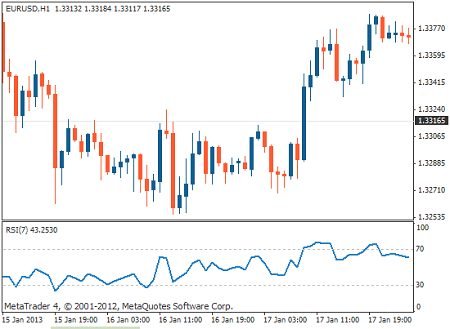
Just like the Stochastic indicator, RSI points to overbought and oversold conditions in the market. If RSI is above 70, the market is overbought, and traders look to sell. If RSI is below 30, the market is in oversold territory, and traders look to buy. You can also use the RSI to help confirm a trend, waiting until it rises above or falls below 50 (depending on the prevailing trend) before entering the market. It is also widely used to generate buy and sell signals.

Some traders find this indicator well suited to short-term trading strategies because of the fast signals it produces.
Average Directional Movement Index (ADX)
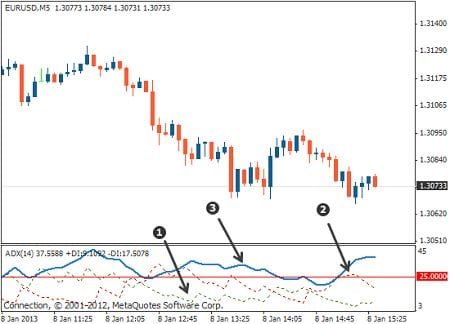
ADX measures the potential strength of a trend. It ranges from 0 to 100, with a reading below 20 pointing to a weak trend and above 50 signaling a strong trend. ADX can be used to help confirm whether a trend is likely to continue. It can also be useful when it is unclear whether closing a trade early makes sense: for example, if ADX starts falling below 50, the current trend, it seems, is still the dominant one.
Read also: Best Indicators for Scalping
Ichimoku Kinko Hyo
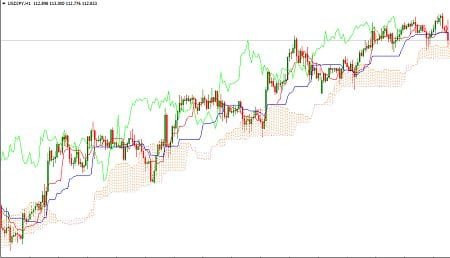
Ichimoku Kinko Hyo is an indicator that measures the strength of future price momentum and identifies future support and resistance zones.
“Ichimoku” translates to “look,” “Kinko” means “balance,” and “Hyo” means “chart,” so the indicator’s name can be translated as “a look at the balance of the chart.”
If the price is above the Senkou Span, the upper line represents the first level of support, and the lower line is the second level. If the price is below the Senkou Span, the lower line becomes the first resistance level, and the upper line becomes the second resistance level.
The Kijun Sen line signals a possible direction for future price movement: if the price is above the blue line, it may continue rising; if it is below, it may continue falling.
Tenkan Sen is a trend indicator: if the red line moves up or down, there is a trend in the market; if it moves sideways, the market is ranging.
Chikou Span is a lagging line: if it crosses the price from below to above, that is a buy signal, and if the green line crosses the price from below, it also points to a buy signal.
Finally, if you hesitate to enter the forex market while waiting for a clear entry point, you may find yourself waiting a long time. But by learning a range of the strongest technical indicators in forex, you can identify suitable strategies and look for potentially favorable times to trade a given currency pair.
Ongoing observation of the strongest technical indicators can also give you signals that may point toward a sell or buy decision, as is the case with any investment, and thorough analysis may help reduce potential risks.
Read also: The Concept of Momentum in Forex | What Are Momentum Indicators
Disclaimer: This article is for educational purposes only and does not constitute investment advice. Technical indicators are analytical tools that can help identify potential trends and reversal points, but their signals can fail and are not guarantees of future price movement. Trading forex and CFDs involves substantial risk, including the risk of losing more than your initial deposit due to leverage, and is not suitable for every investor. Some links on this page may be affiliate links; we may earn a commission if you sign up through them, at no extra cost to you.