
Csr100 Strategy Part 2

Practical steps to start applying the classic support and resistance method, CSR 100 For more, read about CSR100 Strategy Part 1.
After covering the first part of the CSR100 strategy, this second part continues with the practical application.
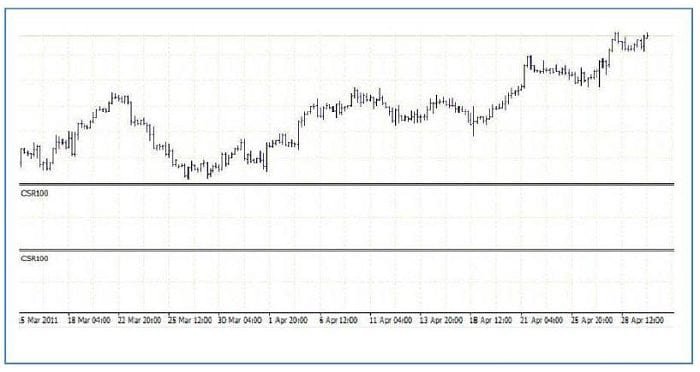
Step 1 – Clear the chart and load the CSR 100 template
Open a fresh chart (any pair and any time frame you prefer) and load the CSR 100 template. The chart will look like this:
Step 2 – Mark resistance that turned into support / support that turned into resistance
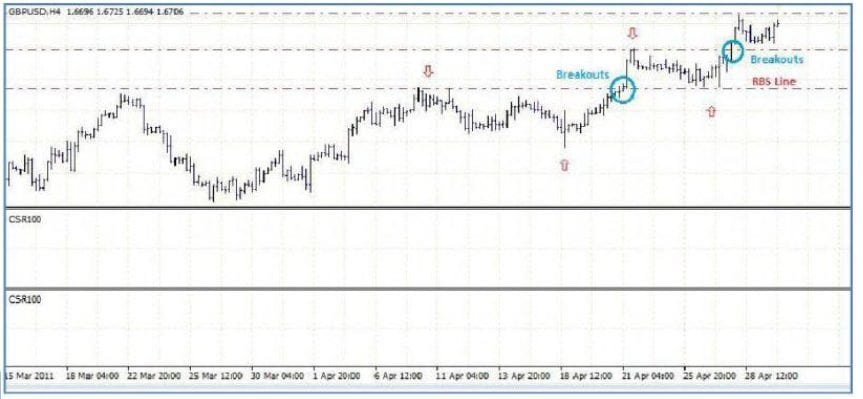
Draw the horizontal lines to find a level or zone where resistance turned into support, or support turned into resistance. Make sure this level or zone contains three things: support, resistance and a break. Use an up arrow for support and a down arrow for resistance. The chart will look like this:

Step 3 – Label the levels (resistance-turned-support / support-turned-resistance, and the break)
Mark the lines with labels so you can recognise each level, whether it is a resistance-turned-support zone or a support-turned-resistance zone. Place these labels on the right of the chart, and put dots at the break points (the role-reversal zone). The chart will look like this:
Step 4 – Mark the price movement (up / down)
You also need labels that define the price movement on the chart so it shows today’s direction.
For an uptrend = low, high, higher low, higher high, higher low, higher high, and so on.
For a downtrend = high, low, lower high, lower low, lower high, lower low, and so on.
The chart will look like this:
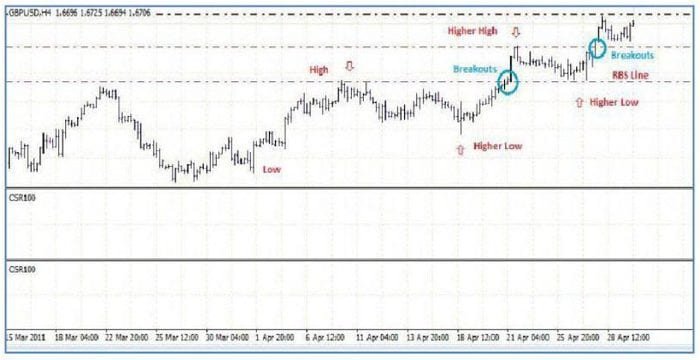
Now the CSR 100 strategy is ready. What you have to do now is practise, practise, then practise. Trade on smaller time frames. In the earlier example the chart is on GBP/USD on the 4-hour time frame, so you can see what happens on the chart and spot opportunities to trade.
Another way to use the CSR 100 strategy
1 – Clear the chart and write out the price movement to identify the current trend
Focus on the price movement.
Uptrend >>> low, high, higher low, higher high, and so on.
Downtrend >>> high, low, lower high, lower low, and so on.

2 – Draw the support and resistance lines
Support >>> happens when price/the market rises then falls but fails to break a line/zone and bounces back up.
Resistance >>> happens when price/the market moves up from a low but fails to break through a line/zone and bounces back down.
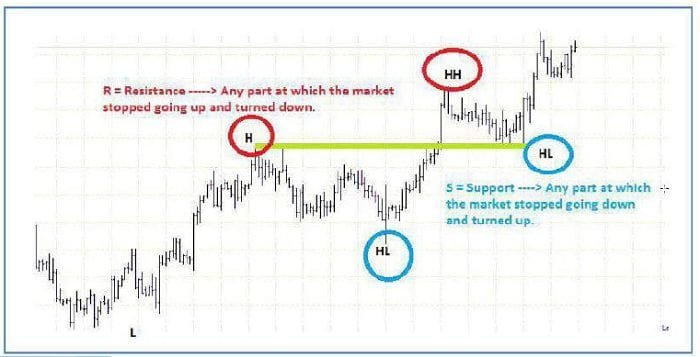
Tip: do not draw too many support and resistance levels, and do not hunt for every possible resistance-turned-support / support-turned-resistance level. Too many lines fill the chart with support and resistance and leave you confused. Just keep it simple and smart.
3 – Find the role-reversal event
Role reversal >>> a support or resistance level that has switched its function (resistance turned into support, or support turned into resistance).
SBR >>> support turned into resistance.
RBS >>> resistance turned into support.
Break >>> a price level that pierced support or resistance; it is a point/line/zone where the resistance or support function switches.
Give the up arrow to support and the down arrow to resistance.

Tip: when you find a resistance-turned-support / support-turned-resistance level, erase the support and resistance lines that are unlikely to change their function so the chart does not become cluttered.
4 – Find the trade entry, the stop loss and the take profit
In the following chart there is an uptrend, so we locate a buy entry.
Trade entry >>> after the break and from the newly formed high. Price will usually pull back to retest the resistance-turned-support zone several times (a first, second or third retest). If price fails to break this resistance-turned-support after several retests, that signals the level is strong enough and confirms it is fully valid. Wait for the second or third retest to enter the trade. In practice, compute the session levels first.
Take profit >>> the highest point after the break (the resistance). You can hold the trade because price may rise and break the resistance created by our trade in the direction of the trend.
Stop loss >>> a few points below the resistance-turned-support level.

Tips for using the CSR 100 method (do’s and don’ts)
Do and don’t tips
- If you use a small time frame, more and faster trading opportunities appear compared with larger time frames; but a larger time frame usually creates more points on that larger time frame. For the CSR 100 method I suggest using a one-hour time frame and taking profit of at least 100 pips.
- Look at sample charts to understand how to find and draw resistance-turned-support and support-turned-resistance levels, then try to apply this on a blank chart. Remember to look for resistance-turned-support or support-turned-resistance levels, and remember that these levels can be a zone.
- Learn more about price action; candlestick study or candlestick patterns can help you with this, but experience matters most, and using indicators is not recommended.
- Entering the trade on the break is not recommended, because we do not know whether the break is true or false. To avoid this it is safer to wait for the CSR 100 conditions to be met.
- Trading against the trend is not recommended, because of the high risk and because we do not know where price will go. The CSR 100 method is to trade with the trend (you must stay disciplined with the rules).
- To build the skill of finding resistance-turned-support or support-turned-resistance levels – it is not hard, it is trial and error. If you practise well, a single day is enough to start finding them.
- If you want something easy, just follow these simple rules of the CSR 100 method: enter the trade after the second or third retest and place take-profit and stop-loss orders (stop loss above/below the broken support/resistance level; take profit at the new support/resistance). This method has a success rate of around 60 to 70%, with a risk-to-reward that is very good, at least 1:2. Note that outcomes vary and any signal can fail.
- The method relies 100% on technical analysis, and you can enter at any time; you just have to avoid news release times. If you enter a trade the stop loss may be hit, so wait 30 minutes or an hour after news is released.
- Entering the trade at the second or third retest is recommended so the level becomes logically valid for resistance to turn into support or support to turn into resistance. If you like risk, enter on the first retest with a tight stop loss.
- If the market/price does not retest the resistance-turned-support or support-turned-resistance level, there are two possibilities: no trade entry – you do not need to trade; learn patience and discipline; and trade entry – enter on the second retest, not the first.
- You do not need price patterns or anything else to confirm price movement. If you know whether it is resistance or support you will be able to define or confirm the price movement. As you learn this method you will see that I use support, resistance and price action to identify the trade, then trade with the trend.
- Clear the chart so it lets you draw support and resistance and the resistance-turned-support / support-turned-resistance levels, and helps you check the trade conditions faster and more accurately.
- This method relies entirely on trading with the trend and on support and resistance levels. As for the role-reversal event, it completes so we can enter the trade while following the basic rule: buy at support and sell at resistance. The role-reversal event shows how much the trend continues, letting us trade with the trend. These are simple enough methods that rely 100% on trading fundamentals.
- This method fits and can be used on all pairs, including gold and silver.
- The CSR 100 rule is to enter on the second retest. The logic is to confirm that the support/resistance has formed. The second retest works not only as a signal to enter the trade but also as a signal to know the trade type (Normal / Creeping / Blow off).
- The most ideal is to wait until price bounces from the first retest or the closest possible zone to it.
- Where do we place the stop loss? Personally I think it is best to use risk-to-reward calculations; for example, if I set a profit target of 100 pips I will set a stop loss of 50 pips.
- Confirm the resistance-turned-support or support-turned-resistance levels on the chart. Note that support and resistance both have to have formed; not every support or resistance level can turn into a resistance-turned-support or support-turned-resistance. When the pattern (resistance-turned-support or support-turned-resistance) forms it must contain:
- a. resistance
- b. a break
- c. support
If we do not find resistance at the support line that turned into support, or support at the line that turned into resistance, then the role reversal does not happen = no trade entry (stay committed).
- Technical analysis uses the concept of highs and lows to identify the trend.
- The stop loss and take profit depend on the trade; each trade has different conditions, but the stop loss stays the same – a few points below/above the resistance-turned-support or support-turned-resistance – and take profit at the highest/lowest point after the break.
- According to the CSR 100 conditions, entering the trade at the second retest is not recommended if price has reached the take-profit level (take profit does not have to be 100 pips; it may be less and may be more). Logically, a double top/bottom pattern forms and is treated as an early signal that the trend will change.
- The stop loss is extremely important. If you trade without a stop loss you are not following the CSR 100 rules.
- All this method needs is knowing what the broken support and resistance are, and the resistance-turned-support and support-turned-resistance levels.
- Why do we wait for the second retest to enter the trade? Because the first retest shows the resistance-turned-support and support-turned-resistance level is not yet valid, so the second retest works as the signal to enter the trade.
Example – selling gold

From the previous chart (one-hour time frame) we can spot changes in the trends early. When the double-top pattern formed, price then successfully broke the support level and formed a new low. Here we have to wait until price pulls back to the break zone before watching for the opportunity to enter a sell trade. The shaded area is the first retest zone that formed (a clear, important retest), and here a support-turned-resistance zone forms. Our best opportunity to enter is when price retests this zone again. The stop loss should be a few points above the highest point price reached at the first retest, and take profit at the new low formed after the break. As a result of applying it on the second retest, the trade made 1700 pips in 24 hours.
Trade entry rules under the CSR 100 method
Entering after the second retest is advised for all three trade types (Normal / Creeping / Blow off), where the first retest acts as a technical filter for the CSR 100 method. For Creeping / Blow off you have no choice but to enter after the second retest, since the first retest represents the formation of the resistance-turned-support and support-turned-resistance levels. But for Normal, if you are a risk-taker you can enter on the first retest with a tight stop loss, so that if the stop is hit it takes the smallest loss and the highest possible profit from the trade. To put this on your own numbers, work out the position size for that stop.
Question
Under the CSR 100 rules:
1 – Define the trade on the larger trend, meaning if I trade on the one-hour time frame I should look at the 4-hour or daily time frame. If the trend is up I only buy; if it is down I only sell.
2 – Wait until a valid resistance-turned-support or support-turned-resistance level forms.
3 – For trade entry, wait until the second or third retest.
The question here is:
1. Do I use pending orders?
2. What do you mean by retest – does price have to reverse from the resistance-turned-support zone or from the support-turned-resistance zone?
Answer
1 – It is up to you; you can use a pending order or a manual order. If you use a pending order, make sure you enter after the second retest, and you must place stop-loss and take-profit orders.
2 – A retest = price tries to create a support/resistance level but fails and bounces against the trend. Price must touch the resistance-turned-support line or the support-turned-resistance line in the Normal case, or enter the resistance-turned-support / support-turned-resistance zone in the Creeping case, or form a price gap in the resistance-turned-support / support-turned-resistance zone in the Blow off case.
Example of a retest in the Normal case

This method was designed to help you trade, so you do not have to sit in front of the computer 24 hours. You can define the trade using CSR 100 analysis, and after the first retest you can place a pending order with a tight stop loss, switch off the computer and do something else.
Back to basics: understanding CSR 100 terms
Uptrend: a series of higher highs and higher lows (a low, then a high, then higher lows, then higher highs), and so on.
Downtrend: a series of lower highs and lower lows (a high, then a low, then a lower high, then a lower low), and so on.
Support: happens when price/the market moves up then falls but fails to break a line/zone and turns back up. “When the market stops falling and turns up.”
Resistance: happens when price/the market moves up from the low but fails to break through a line/zone and turns back down. “When the market stops rising and turns down.”
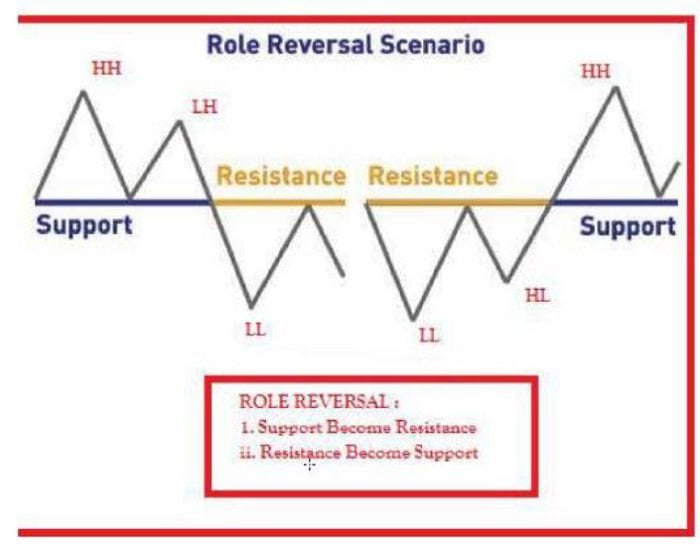
Role reversal: support or resistance swapping roles at a zone or line – SBR and RBS.
SBR <<<< Support Becomes Resistance.
RBS <<<< Resistance Becomes Support.
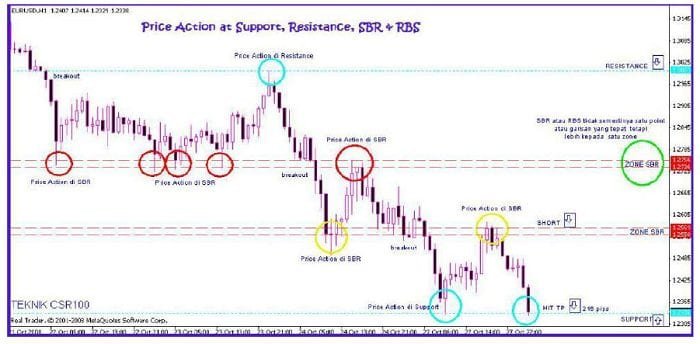
Break: price succeeds in piercing support or resistance, and role reversal between support and resistance usually happens in this zone.
TP <<<< Target Profit.
SL <<<< Stop Loss.

Example of a support line/zone that turned into resistance

Three important things to remember and follow when trading
1 – Trade with the trend: the trend is your friend, and never trade against the trend. It is easier to make a profit when you trade with the trend than against it. Uptrend = buy only; downtrend = sell only.
2 – Buy at support: buyers enter the market at support levels and overcome the sellers. Here you enter with a buy only at support levels; buying at resistance levels is not correct. CSR 100 <<<< buy when resistance turns into support.
3 – Sell at resistance: sellers enter the market at resistance levels and overcome the buyers. Here you enter with a sell only at resistance levels; if you sell at support levels that is not correct. CSR 100 <<<< sell when support turns into resistance.
Trading rules using the CSR 100 method
1 – The trend sets the path; each time frame has its own trend. Make sure the trade is with the trend on the larger time frame. Trading with the trend on a larger time frame gives a good decision. When the trend analysis on your time frame matches two or more larger time frames, it provides good opportunities.
2 – Enter the take profit and the stop loss. In a downtrend = support becomes resistance = sell only.
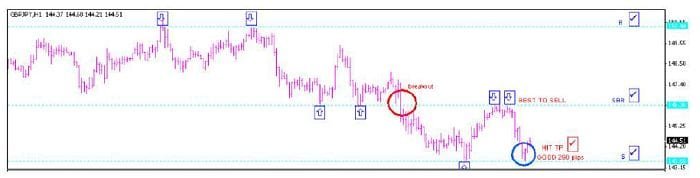
3 – Trade entry after the break and from the new low. Price will usually pull back and retest several times following the rule “support becomes resistance.” If price fails to pierce this support-turned-resistance level after several retests, that points to the strength of the level and confirms support has turned into resistance. Wait for the second or third retest to enter the trade.
4 – Take profit: the lowest point after the break (the new low/last support). The minimum take profit for CSR 100 = 100 pips.
5 – Stop loss: a few points above the support-turned-resistance level, or according to the money-management plan you designed. Set the stop-loss level and how many points you will lose; in an uptrend it is exactly the opposite.
How can you find an analytical system for the CSR 100 method?
Step 1: Choose the time frame you want to trade on. If you chose the 15-minute time frame, please look at the one-hour / 4-hour time frame to identify the current trend. If you chose the one-hour time frame, please look at the 4-hour / daily time frame to identify the current trend.
Step 2: How to identify today’s direction – please refer to the second lesson.
Step 3: Analyse the time frame you will trade on. The main goal is to find a resistance-turned-support zone or a support-turned-resistance zone.
1 – Draw the support and resistance lines.
2 – Mark the break zone.
3 – Wait for the first retest = confirmation of the break (resistance turned into support or support-turned-resistance zone). Wait for the opportunity to enter the trade at the second or third retest.
Stop loss: some points below/above the resistance-turned-support or support-turned-resistance zone.
Take profit: the first price target at the new high/low; the second price target depends on the market condition.
The modified CSR 100 method
Price below the 62-day exponential moving average (close) >>> downtrend.
Price above the 62-day exponential moving average (close) >>> uptrend.
Moving averages help to show whether the trend is happening and confirm that we are trading with the trend. The basic concept of this method is support and resistance and how the role-reversal event can be used to enter trades.
How can you enter the trade?

Downtrend: to enter a sell trade, wait until support turns into resistance, then enter a sell when price bounces from this level or from the 62-day exponential moving average (see the previous chart: you will find the support-turned-resistance level and the 62-day EMA are at roughly the same price, which points to the strength of the resistance and makes it suitable to enter a sell).
First profit target >>> the lowest point (the support formed after the break happens).
Second profit target >>> because we trade with the trend, the lowest possible point from the break will be good. Here we used the Accelerator Oscillator to help maximise profit, and when the indicator switches from red to green we close the sell trade.
Stop loss >>> a few points above the support-turned-resistance level / the 62-day EMA, or when the candle closes above the 62-day EMA.
The first retest in this method points to support or resistance having formed, and is also treated as a signal that the support-turned-resistance or resistance-turned-support levels are forming. The second retest is the point at which we explore opportunities to enter trades; the stop loss is placed a few points above or below the first retest level. If the maximum profit target is reached and the stop loss is not hit, then the stop loss is as small as possible.
The weak-pullback strategy
4-hour time frame, GBP/CHF pair.
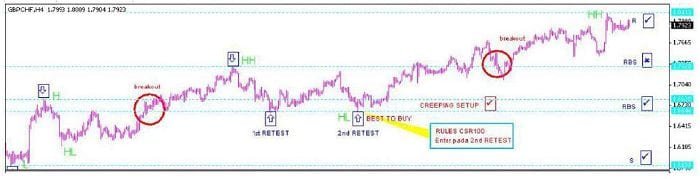
The first retest level is the level that confirms the signal. We enter the trade on the second retest with a stop loss a few points below the first retest level.
A chart to learn from:

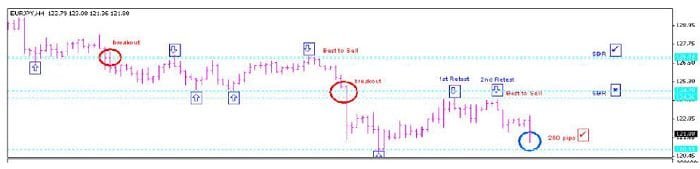
Remember: the support-turned-resistance / resistance-turned-support levels can be a zone and not just a line. In the weak-pullback strategy (Creeping) and the price explosion (Blow off), these levels form in a zone, which is why the first retest level is important not only as a filter but as an early signal that these levels are forming.
Each time frame has its own trend. Under the CSR 100 rules you trade with the trend on the larger time frames for the best results, and the more the method can be applied, the more we can enter a trade if the reward-to-risk is good.
Examples:
EUR/USD 4-hour:

The role-reversal event on EUR/GBP:
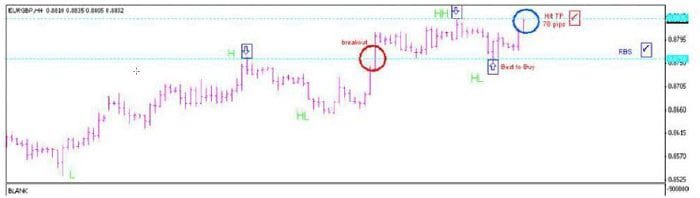


Retest – price action at SBR and RBS:
Example of an uptrend >>> make sure the price movement started with a low, then look for clear resistance first (a high). This high can be retested once, maybe twice or more. The retest showed more resistance, and resistance stays strong until price bounces from the higher low. Price will try again to pierce the resistance and will usually form a new high or new resistance, called a higher high. The trend shows its continuation through this breakout, and if it fails to pierce the higher high, the resistance will usually bounce back to the previous high. Here the resistance function turns into support – what is known as the role-reversal event – and this is the right time to hunt for opportunities to enter buy trades when resistances turn into support.
Entering the trade after the second retest of resistance-turning-into-support is advised. Price will have bounced but not into the role-reversal zone; if that happens there is no entry for the CSR 100 strategy. The best stop loss is a few points below the resistance-turned-support level.
Do not look directly at the open/close/high/low of the candle; just try to keep the CSR 100 method simple. Candlestick study can indeed help, but in this method we can forget it and focus on the clear supports and resistances and on trading with the trend.
Understanding price action (analysing highs and lows) and also the role-reversal event is very important, and this is what we need for the CSR 100 method.

In the previous chart: I will place a stop loss 20–30 pips below the support level (the first retest), then enter a buy trade at support (the second retest). For the profit target, make sure you place it at the highest point after the break (resistance = 190 pips). So the risk-to-reward is 1:6: if price hits the stop loss you lose 30 pips, and if it heads to the profit target you make 190 pips.
Example on gold, 4-hour:
Price action on the 4-hour is an uptrend; the break is at the highs; an important high at HH; price bounced off the resistance-turned-support level – the best time to buy.

Gold update:

Gold update:

No method lasts forever
This means that while your method is working you should not change it, because you have taken small consecutive losses and that is expected. Your overall performance is determined by how you handle it, not by the method being wrong.
Learn from mistakes and start from there. It also means you need to know when your method is no longer working. So how do you tell the difference between a losing streak and major shifts in market flows that make your method lose? By doing some homework.
If your method can be applied in different markets, take your time and test it on different markets and watch whether it works or not. If your signals start to fail in more than one market, then it is time to step back and trade on a demo account for a week or two to see whether it is a temporary state or your method is declining. The earlier you know that, the better for assessing your overall performance. We all have to keep learning, because the market changes and we have to change with it or fall far behind.
Tips
Price movement is hard to predict, and as a user of the CSR 100 method you really have to be careful about market movement. The important thing in our method is that if you find a support-turned-resistance or resistance-turned-support level, enter the trade; and if you do not find them, take a short rest. Trade what you see, not what you think, and keep it as simple as possible.
Example on EUR/USD:

Watching forex trends is an important idea here, and the method above is a simple three-step method you can use correctly, since it helps you use each strong forex trend and can support long-term currency trading if applied with discipline and risk control.
Try this strategy on a demo account first
A strategy that looks clear in an article can behave very differently under real spreads and volatility. Testing it on a demo account shows you how it performs before you commit any capital.
Advertising disclosure: partner link. Easy Trade may receive compensation. Educational content, not financial advice. CFDs carry a high risk of losing your capital.
Risk disclaimer: This article is for educational purposes only and is not investment advice or a recommendation to trade. The CSR 100 method is a technical approach whose signals can fail; past results such as the examples shown do not guarantee future outcomes. Trading forex and CFDs on leverage carries a high risk of losing money rapidly, and you can lose more than your initial deposit. Do your own research and only trade with money you can afford to lose. Easy Trade may earn a commission from broker links on this site at no extra cost to you.