
Csr100 Strategy Part 1

{If you have mastered this method and found it useful, we hope you pass it on to others.} It helps to understand Broken Trend Line Strategy.
What Is the CSR100 Strategy, Technically?
Traders around the world are always looking for a perfect trading system that will make them rich fast, chasing a set of magic trading indicators that simply do not exist. But if you want the approach that can turn you into a successful forex trader, this is the one for you. It is a quick and solid way to work toward profits, yet it demands discipline, commitment, and hard work from you. Think of a skilled footballer like Cristiano Ronaldo: good boots or good balls are not enough. It is the hard work you put into learning how to play that makes the ball the reason you become good at the game.
The CSR 100 method is simple, and you do not need to use any of those magic indicators. You only need to learn the principles, and the principles of forex trading. To understand the purpose of this method clearly, you have to learn it step by step, level by level, so each topic can be discussed and understood clearly. Keep it simple….
CSR 100 stands for “Classical Support & Resistance,” and it targets 100 pips of profit. The method rests on two important principles:
Support and resistance
Trade with the trend
The method relies on price movement and support and resistance lines. There are no indicators; the original CSR 100 method uses no indicator at all. It is not forbidden to develop the method by adding an indicator until you find the trading style that suits you, but it is important to keep the chart as simple as possible.
So using indicators is not recommended, and if you do use one, use the minimum possible. Keep the CSR 100 method simple and smart.
Lesson One: Support and Resistance
A. Support and resistance
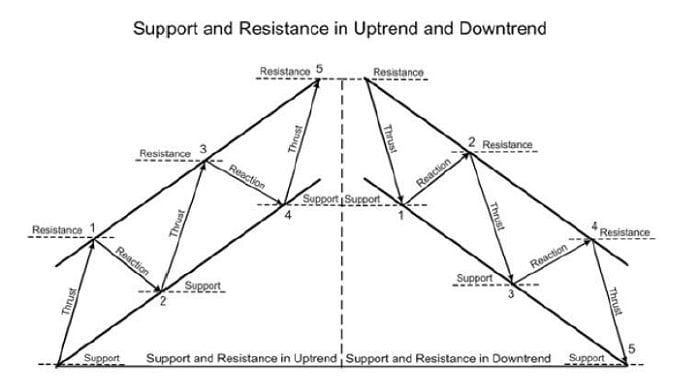
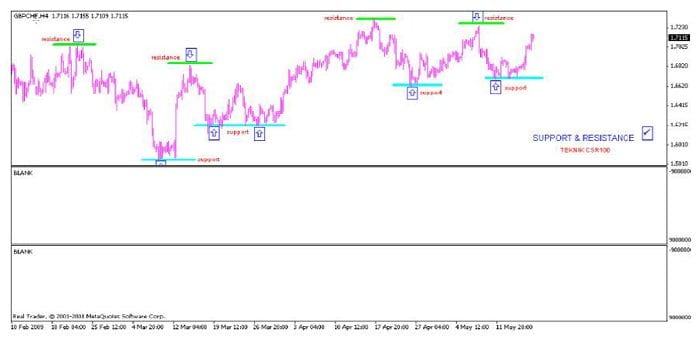
Support: happens when the price/market moves up and then falls but fails to break a line/zone and turns back up, once the market stops falling and shifts higher.
Resistance: happens when the price/market moves up from a bottom but fails to break through a line/zone and falls again, once the market stops rising and shifts lower.
B. Breaks and role reversal
The break: when price breaks support or resistance, that area is where the role of support and resistance changes.
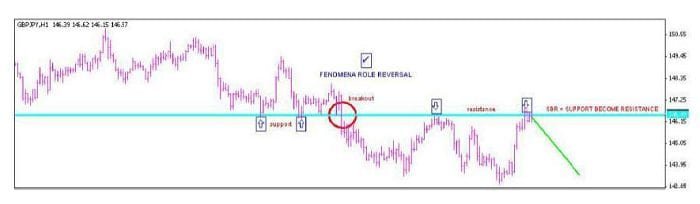
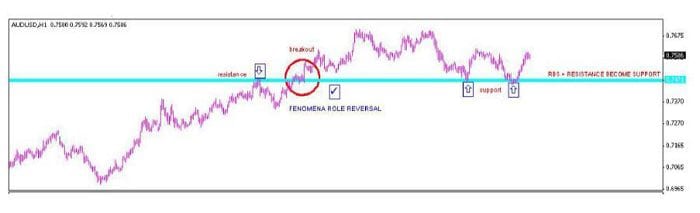
Role reversal: support or resistance swapping roles at an SBR or RBS zone or line.
SBR: Support Becomes Resistance<<<<<< support turned into resistance
RBS: Resistance Becomes Support<<<<<< resistance turned into support
The break:
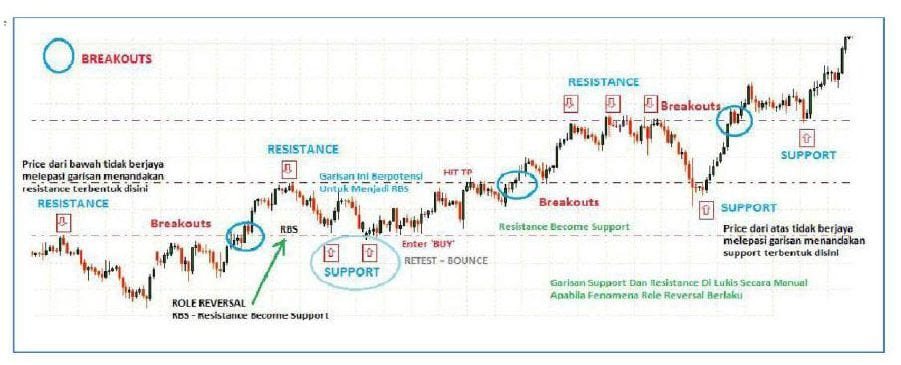
Questions:
– How can I tell whether this is a break or a reversal? How many pips are needed to call it a break or a reversal? On a small timeframe it looks like it is going in the direction of the break, but on a larger timeframe it broke through, so which timeframe do we follow? And the same question for a reversal?
Every timeframe is different. You only need to focus on the timeframe you are analyzing. After a break succeeds, a clear new bottom (support) or a clear new top (resistance) forms; here you can say it is a valid break. There is no fixed pip count that makes a break valid, and you do not need to move to a larger timeframe to see the break. The reason you might move to a larger timeframe is to identify the current trend, so trade on larger timeframes.
Important: the break is an early signal that the current trend continues, so we should get ready to catch opportunities if the price makes a “correction/pullback” from the break zone (SBR and RBS). This is what we call trading with the trend.
– What is the best timeframe to trade?
Any timeframe can be used. The lowest timeframe used is 15 minutes; the 30-minute timeframe is not recommended; the preferred timeframe is 4 hours.
Lesson Two: The Trend
A. Price movement: knowing the current trend is certainly the best leading indicator.
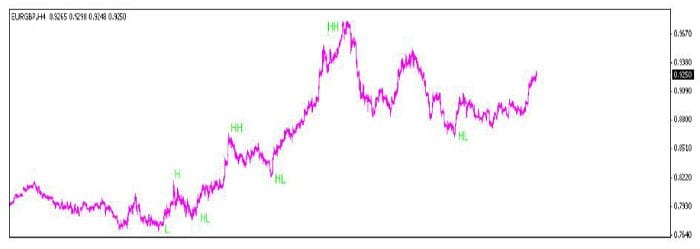
The uptrend: a series of higher highs and higher lows (a low, then a high, then rising lows, then rising highs).
Price movement in an uptrend: low, high, higher low, higher high, higher low, higher high, and so on…
What to do here: uptrend = buy only. (Selling is not recommended, unless the trend is weak, where price may pull back and you take a few pips selling, but this is not advised for beginners.)
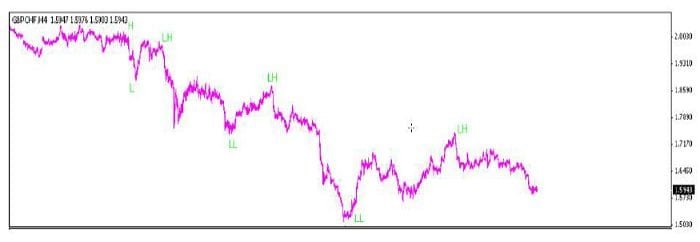
The downtrend: a series of lower highs and lower lows (a high, then a low, then a lower high, then a lower low).
Price movement in a downtrend: high, low, lower high, lower low, lower high, lower low, and so on…
What to do here: downtrend = sell only. (Buying is not recommended, unless the trend is weak, where it may pull back and you buy a few pips, but this is not advised for beginners.)
B. Trading basics:
Three important things to remember and follow when you trade:
1- Trade with the trend: “The trend is your friend,” and never trade against the trend. It is easier to make a profit when you trade with the trend than against it.
Uptrend = buy only Downtrend = sell only
2- Buy at support: buyers enter the market at support levels and overcome the sellers; here you enter only with buys at support levels. Buying at resistance levels is not correct.
CSR 100 >>>>> Buy when resistance turns into support
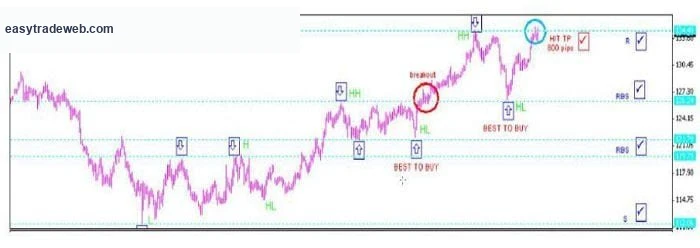
3- Sell at resistance: sellers enter the market at resistance levels and overcome the buyers; here you enter only with sells at resistance levels. If you sell at support levels, that is not correct.
CSR 100 >>>>> Sell when support turns into resistance…
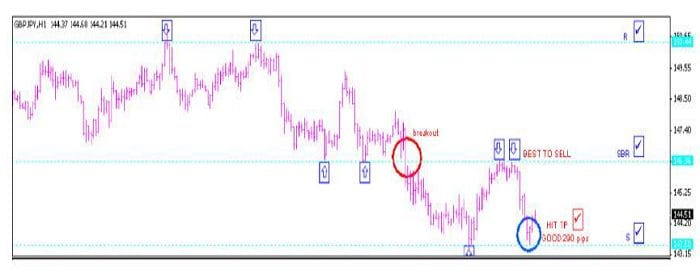
What is the role-reversal phenomenon?
It happens when support or resistance flips in a given zone: support becomes resistance and resistance becomes support.
SBR >>>>> support turning into resistance
Price manages to break support, then forms a new bottom (new support), then returns to retest the support zone/line but fails to break it; here the reversal function occurs at the zone/line, and this area becomes a resistance level.
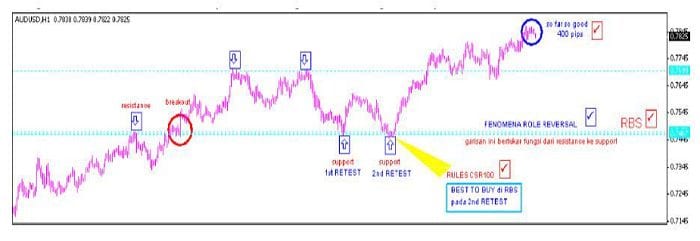
RBS >>>>> resistance turning into support
Price manages to break through resistance, then forms a new top (new resistance), then returns to retest the resistance zone/line but fails to break through it; here the reversal function occurs at the zone/line, and this area becomes a support level.
The following chart gives a clear picture of the above:
Lesson Three: The Rules of the CSR 100 Strategy
1- The trend sets the path >>> every timeframe has its own trend. Make sure the trade is with the trend on the larger timeframe; trading with the trend on a larger timeframe gives a good decision. When you analyze the trend on a timeframe and it matches two or more larger timeframes, it offers good opportunities.
1- If you use the 4-hour timeframe, use the daily/weekly timeframe to define the trend.
2- If you use the 1-hour timeframe, use the 4-hour/daily timeframe to define the trend.
3- If you use the 10-minute timeframe, use the 1-hour/4-hour timeframe to define the trend.
2- Set your take profit >>> (take profit) and stop loss >>> (stop loss)
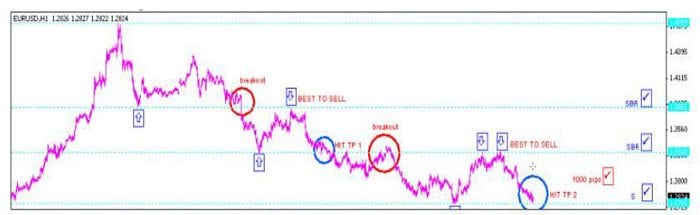
In a downtrend = support becomes resistance = sell only
1- Trade entry >> after the break and from the new bottom, price will usually pull back and retest several times according to the rule “support becomes resistance.” If price fails to break through this support-turned-resistance level after several tests, that points to the strength of the level and confirms the support has turned into resistance. You should wait for the second or third test before entering the trade.
2- Take profit >> the lowest point after the break (the new bottom / last support). The minimum take profit for CSR 100 is 100 pips.
3- Stop loss >> a few pips above the support level that turned into resistance, or according to the money-management plan you have built, which sets your stop-loss level and how many pips you will lose.
In an uptrend = resistance becomes support = buy only
1- Trade entry >> after the break, when a new top forms, price will usually pull back and retest several times according to the rule (resistance becomes support). If price fails to break through this resistance-turned-support level after several tests, that points to the strength of the level and confirms the resistance has turned into support. You should wait for the second or third test before entering the trade.
2- Take profit >> the highest point after the break (the new top / last resistance). The minimum take profit for CSR 100 is 100 pips.
3- Stop loss >> a few pips below the resistance level that turned into support, or according to the money-management plan you have built, which sets your stop-loss level and how many pips you will lose.
Questions:
On which timeframe do we draw the support and resistance lines? Can we place support and resistance levels according to the timeframe, or do we place them on the 4-hour timeframe and then move to the 1-hour, then 30-minute, then 10-minute?
If you use the 4-hour timeframe, place the support and resistance levels on the 4-hour timeframe only, since every timeframe has its own trend. You can place support and resistance levels on different timeframes to set your entry points on each timeframe. An uptrend on a given timeframe may be a correction on a larger one, and at best make sure to align the timeframe with the trading direction across two larger timeframes. If you are a risk-taker, you can enter a trade using the CSR 100 method on any timeframe. What matters is that you fully follow the CSR 100 rules.
The CSR 100 Strategy Is Simple – A Tip
For users of the CSR 100 method, it is best to enter the trade once the CSR 100 rules are complete. Price patterns and Japanese candlesticks can indeed recognize a change in trend, but to keep this method workable and simple, it is better to focus only on price movement in the current trend. In other words: we do not need to know when price movement reverses; we use price action only to define the trend.
Example: wait for the CSR 100 rules to be complete.
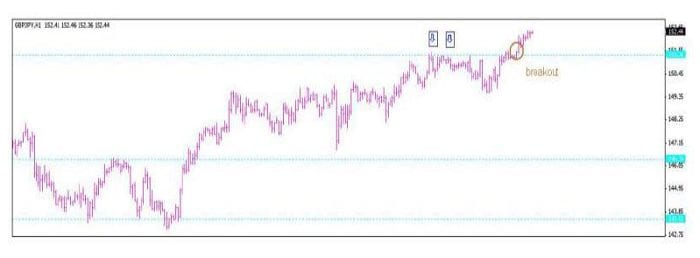
Looking at the previous chart, in this theory the analysis is considered correct, and the CSR 100 pattern has just completed, so wait until price forms a clear new top (resistance) after the break, and then we trade with the trend.
What is meant by price moving in the current trend?
The trend is not objective; every timeframe has its own trend. An uptrend/downtrend on a small timeframe may be a pullback or correction on a larger one. I use price action to identify the sure direction of the current trend, and I believe price action is the best indicator compared with other indicators. To convince yourself with price action, you have to understand the concept of analyzing highs and lows.
Analyzing highs and lows
Uptrend >> a series of higher highs and higher lows (low, high, higher low, higher high, and so on).
Downtrend >> a series of lower highs and lower lows (high, low, lower high, lower low, and so on).
Example: analyzing highs and lows; note each marked range.
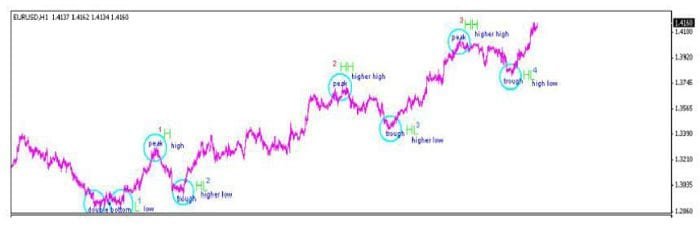
In an uptrend, price action should start with a low followed by a high, then a higher low, then a higher high, and so on. Look at the highs: a high, then a higher high, then another higher high; now we have highs above the previous high, so we can say there is a new uptrend. Look at the lows: a low, then a higher low, then another higher low, and so on; here the lows are above the previous lows, so we can say there is a new uptrend.
And this is what an uptrend means: a series of higher highs and higher lows.
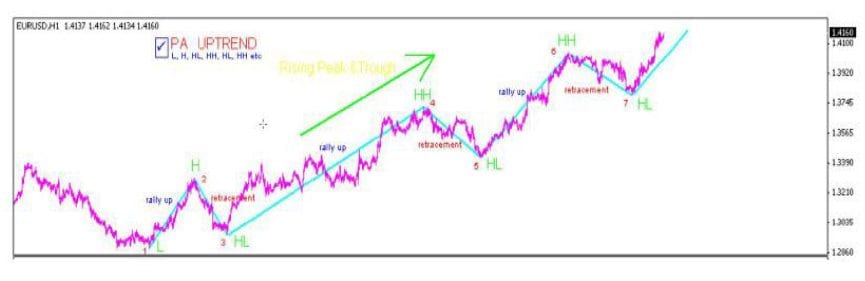
In the previous chart, on the 1-hour timeframe for the euro, price moved in an uptrend. Prices do not move up in a straight line; they move in a zigzag, oscillating and forming highs and lows, a rise then a correction, and the chart shows it is definitely an uptrend. In a downtrend, use the same concept but in reverse.
The Skill You Need to Draw Support and Resistance With Price Action
Focus only on the clear price action (the highs and lows).
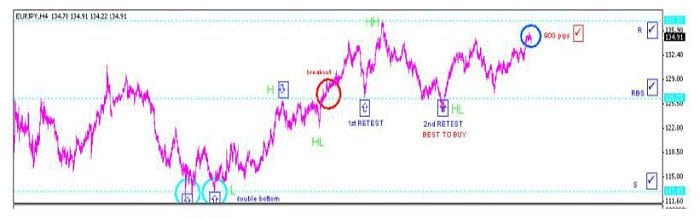
It is not about how many horizontal lines you need to draw on the chart. In this strategy, all that matters is the clear highs and lows (price action), in other words the clear supports and resistances.
Example of an uptrend >> make sure price action started with a low, then look for a clear resistance first (a high). This high can be retested once, maybe twice or more; the retest shows more resistance, and the resistance stays strong until price bounces from the higher low. Price will try again to break through the resistance and will usually form a new top or new resistance called a higher high; the trend shows its continuation through this break. If it fails to break the higher high, the resistance will usually bounce back to the previous high; here the resistance function turns into support, what is known as role reversal. This is the right time for us to catch opportunities to enter buy trades when resistance turns into support. It is advised to enter the trade after the second test of resistance turning into support, when price has pulled back but not to the role-reversal zone; if that happens, there is no entry for the CSR 100 strategy. The best stop loss is a few pips below the resistance level that turned into support.
Where do you place the horizontal lines??
Where do you place the horizontal lines? At the open/close price or at the highest/lowest price?
It does not matter, because when resistance turns into support or support turns into resistance, they have no fixed base or exact point; it may be a zone. Looking at the following chart, do not look directly at the candle open/close/high/low. Just try to keep the CSR 100 method simple. Candlestick knowledge can indeed help, but in this method we can forget it and focus on the clear supports and resistances and trading with the trend. Understanding price action (analyzing highs and lows) and the role-reversal phenomenon is extremely important, and this is what we need for the CSR 100 method.
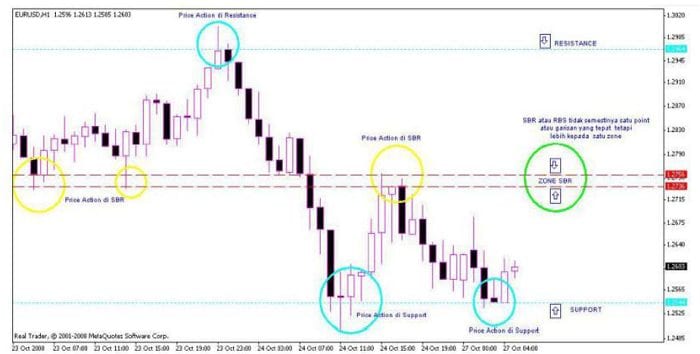
Note: support or resistance is a line, but when resistance turns into support and support into resistance, it can be a line or a zone.
Trading With the Trend
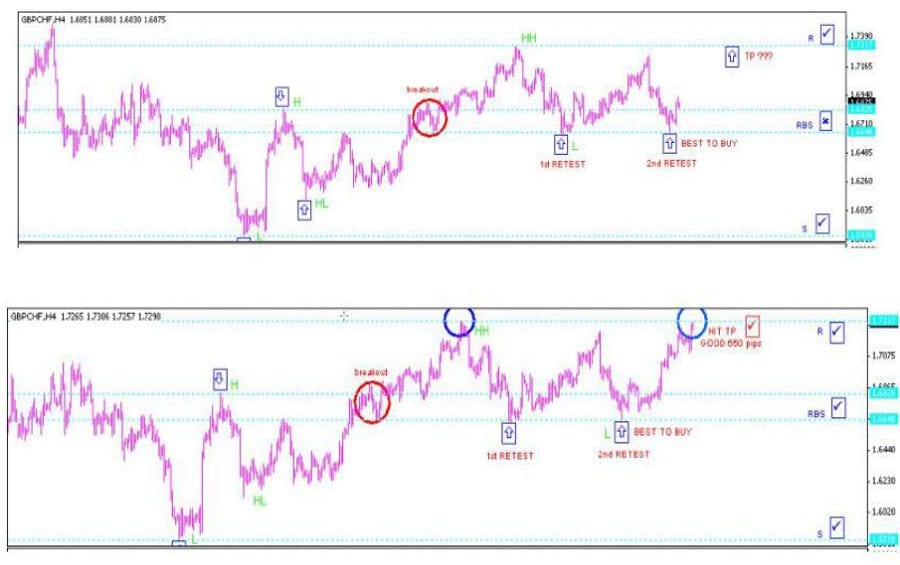
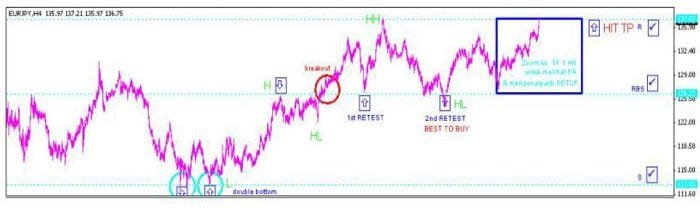
Let us look at a chart to understand the concept of trading with the trend on the 4-hour timeframe. The trend currently rests on price moving up, and now we focus on the blue box. The 4-hour timeframe shows price moving up, and if we prefer a buy opportunity at the second test on the 4-hour timeframe, we can zoom into a smaller timeframe to see whether the CSR 100 conditions occur so we can enter the trade. Just enter an exploratory buy on the 1-hour timeframe as long as the trend on the 4-hour is up; this is what we call trading with the trend using a larger timeframe.
And let us take a look at the 1-hour timeframe (a zoom into the blue box on the 4-hour timeframe).
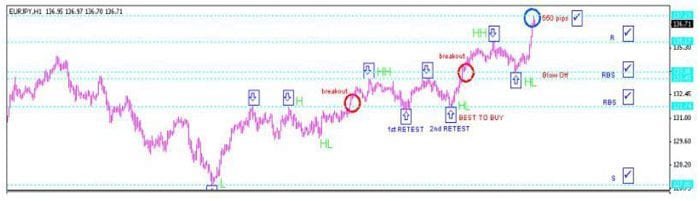
Buy at the second test. In this example the move ran about 550 pips.
Lesson Four: The Types of CSR 100 Trades
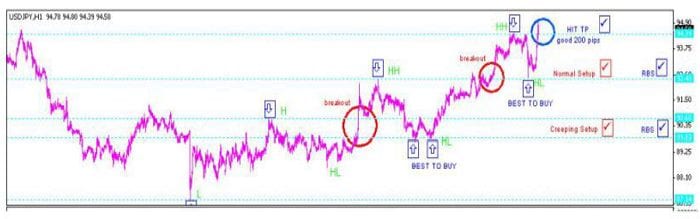
Price tests the level (Normal):
1- This trade usually happens in the middle of the trend.
2- After the break, price bounces toward the support that turned into resistance or the resistance that turned into support.
3- The trade is easy to recognize.
4- When price tests the level it may capture a large number of pips, but not like the weak bounce (Creeping).
Example >>>>>>. Before relying on an estimate alone, work the levels out before the open.
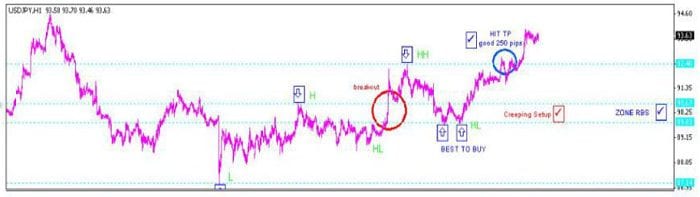
The weak bounce (Creeping):
1- This trade usually happens at the start of the trend.
2- After the break, price retreats at the spread level toward the resistance that turned into support / the support that turned into resistance, known as the overlapping/non-overlapping range.
3- Usually this trade captures a large number of pips the earlier we enter to trade with the trend.
4- It is suggested to enter the trade after the second test.
Example >>>>>>
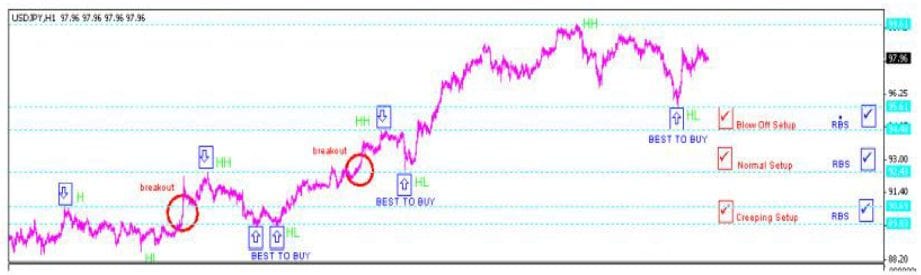
The strong (violent) bounce (Blow off):
1- This trade usually happens at the end of the trend.
2- After the break, price bounces but not to the break zone of the support/resistance, and there is a gap >>> at the resistance that turned into support / the support that turned into resistance.
3- This trade captures a small number of pips compared with the previous two types, and it is a good time to close the Normal or Creeping trades we entered if the target is reached.
4- It is advised to enter the trade after the second test.
Example >>>>>>
Lesson Five – The Final Lesson
All you need is four lessons to learn this method, and the most important thing is practice, then practice, then practice until you build experience.
Advice from a professional trader:
1- Look for the method you believe you can make money from over time and stick with it.
2- Try to understand the theoretical foundations of this method.
3- Make small trades until you are convinced the method works.
4- Your success (making a profit) comes from executing the method correctly, not from guessing the market direction.
5- Read advice number 4 again.
6- Stop thinking after you enter the trade; the thinking comes before you enter, not during the trade.
The principles:
– Pairs: based on the above, this method suits all types of pairs, including gold and silver.
– Timeframes: the timeframe is not a problem; you can use any timeframe (monthly, weekly, daily, 4-hour, 1-hour, 15-minute), but the 30-minute timeframe is not recommended.
– Tools: support and resistance lines and price action, meaning no indicators.
In short, the CSR100 strategy is one way to read strong, breakout-based moves in currency trading. A breakout is simply a move on a forex chart where a new high or low forms and resistance or support is broken.
While it may seem that you are not buying or selling at the very top, with the CSR100 strategy you raise the odds that the trend continues. Most forex traders wait for the breakout to come back so they can enter at a better price, but that often means they miss the move, because when a breakout happens you have a strong new trend and a retracement is unlikely. Most traders do not buy or sell the breakout, and that is exactly the reasoning behind the CSR100 method.
Part Two: CSR100 Strategy – Part Two: Application.
Try this strategy on a demo account first
A strategy that looks clear in an article can behave very differently under real spreads and volatility. Testing it on a demo account shows you how it performs before you commit any capital.
Advertising disclosure: partner link. Easy Trade may receive compensation. Educational content, not financial advice. CFDs carry a high risk of losing your capital. To translate this into figures of your own, size the position before entering.