
Ichimoku Trading Strategy

In the late 1930s, Japanese journalist Goichi Hosoda developed the Ichimoku indicator, which reads the current state of the market by combining several moving averages into one system. It signals the likely direction of price and also marks out support and resistance zones. The Ichimoku indicator can be used on its own — it is a complete strategy in itself that can be applied across trading markets. This article covers what the Ichimoku indicator is and the best trading strategy built around it.
What Is the Ichimoku Indicator?
Ichimoku indicator: a set of moving averages combined into a single system that is used to read the direction of the market.
The Ichimoku indicator is made up of:
- Tenkan-sen (conversion line) — a 9-period moving average
- Kijun-sen (base line) — a 26-period moving average
- Senkou Span A (leading line 1) — a 26-period moving average
- Senkou Span B (leading line 2) — a 52-period moving average
- The Cloud (Kumo), formed between leading line 1 and leading line 2
- Chikou Span (lagging line), which plots the current closing price shifted back 26 periods
See the chart below:
Secrets of the Ichimoku Indicator
See the chart below.
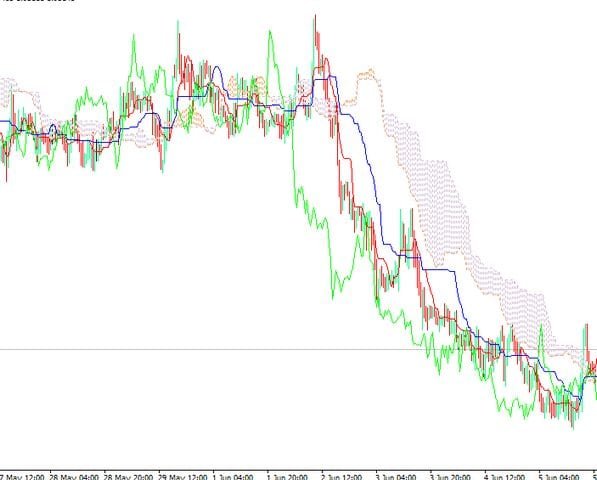
In the chart above, you can read price direction from the indicator’s cloud: when price is above the cloud, that points to an uptrend; when price is below the cloud, that points to a downtrend; and when price sits inside the cloud, that points to a sideways range.
The Ichimoku indicator can also give signals that a trend is changing.
When the Tenkan-sen (red line) crosses the Kijun-sen (blue line) to the upside, that points to a shift from a downtrend to an uptrend. Conversely, when the Tenkan-sen crosses the Kijun-sen to the downside, that points to a shift from an uptrend to a downtrend.
See the chart below:
In the chart above, price was moving in a downtrend, and when the Tenkan-sen (red line) crossed the Kijun-sen (blue line) to the upside, price shifted into an uptrend; when it crossed back to the downside, price shifted back into a downtrend.
The strength of Ichimoku signals is assessed based on:
How Far Price Sits From the Cloud
The further price sits from the cloud, the stronger the trend is considered, and the more likely it is to continue. See the chart below.
In the chart above, the trend was firmly down. Notice the distance between price and the cloud — as price got closer to the cloud, the trend began moving into a sideways range.
Also keep in mind that the relationship between leading line 1 and leading line 2 is used to gauge how strong the current trend is: when the gap between the two lines is small, the cloud is thin; when the gap is wide, the cloud is thick. A thin cloud points to a stronger trend, while a thick cloud points to a weaker one.
In the chart above the cloud was thin, so the trend was strong. See the chart below:
In the chart above, the cloud was thick, so the trend was not strong.
How Far the Lagging Line Sits From the Cloud
The further the lagging line sits from the cloud, the stronger the trend is considered — in the earlier chart, the lagging line (green line) sat well away from the cloud.
The Ichimoku indicator is useful for day trading and scalping, where decisions need to be made quickly. It is often combined with other strategies or technical indicators, such as RSI, so traders get a fuller picture of support and resistance.
Related reading:
RSI indicator and buy/sell signals
Trading the Ichimoku indicator takes a lot of self-discipline, because you have to wait for the best signals to form. It’s best to use the indicator’s default settings and not change them, since they’re built on a well-tested system.
Now that you understand how the indicator works, let’s look at the best trading strategy built around the Ichimoku indicator.
Best Ichimoku Trading Strategy
As noted above, the Ichimoku indicator is a complete system that can be traded on its own — it shows the current trend, its strength, and it can produce buy and sell signals.

Note: the Ichimoku indicator can be used on any timeframe. It isn’t limited to the short timeframes suited to day trading or scalping — it can also be used for longer-term trading on higher timeframes.
This strategy shows how to enter a trend near its start, with the aim of capturing more of the move.
We’ll break this strategy down into five steps.
Buy rules first
Step 1: Identify the Trend
Wait for price to cross the Ichimoku cloud and close above it. When price closes above the cloud, that points to an uptrend. See the chart below.
The reason for this step is that the Ichimoku cloud usually acts as a support/resistance zone — and support and resistance aren’t limited to horizontal lines; there’s more than one way to mark support and resistance levels on a chart. To translate this into figures of your own, cross-check with calculated pivot levels.
That’s why it’s necessary to wait for a close above the cloud, since a false break can happen here just as it does around horizontal support and resistance levels.
We won’t enter a trade just because price crossed the cloud — which brings us to step two.
Step 2: Wait for the Crossover — the Tenkan-sen Must Cross the Kijun-sen
Once price has closed above the cloud, that points to a shift from a downtrend to an uptrend, but we need one more confirmation before we can take a buy trade.
We’ll wait for the Tenkan-sen to cross above the Kijun-sen, as in the chart below.
Now that both conditions are met, it’s time to enter — which brings us to step three.
Step 3: How to Time Your Entry With the Ichimoku Indicator
You can open a buy trade at the open of the candle that follows the close candle. See the chart below.
In the chart above, the buy trade was opened at the open of the candle following the close candle, and price went on to move up strongly.
Of course, we can’t skip the most important part of the Ichimoku strategy — setting a stop-loss — which brings us to step four.
Step 4: Set Your Stop-Loss
The ideal spot for the stop-loss in this strategy is the low of the breakout candle, as in the chart below.
You can move the stop-loss to the entry point once price crosses back into the cloud, or close the trade entirely at that point — it comes down to your own read of the current market.
The next logical thing you need is a take-profit order, which brings us to the last rule of the Ichimoku strategy.
Step 5: Set Your Take-Profit
You can set the take-profit at twice the distance of the stop-loss, which works fine, but it’s often better to leave the trade open and only close it once the indicator signals that the trend has changed — a downward cross of the Tenkan-sen below the Kijun-sen, as in the chart below.
You can also wait until price breaks below the cloud, but that means risking giving back part of the profit the trade has already made.
Note: the above walks through a buy-trade example using the Ichimoku strategy. Use the same rules for sell trades, mirrored in the opposite direction.
Try this strategy on a demo account first
A strategy that looks clear in an article can behave very differently under real spreads and volatility. Testing it on a demo account shows you how it performs before you commit any capital.
Advertising disclosure: partner link. Easy Trade may receive compensation. Educational content, not financial advice. CFDs carry a high risk of losing your capital.
Conclusion
- The Ichimoku trading strategy looks a little different from what you may be used to in technical analysis. If you find it hard to pin down real support and resistance levels, this indicator can help.
- The Ichimoku indicator is useful for day trading and scalping, where decisions need to be made quickly. It is often combined with other strategies or technical indicators, such as RSI, so traders get a fuller picture of support and resistance.
- Trading the Ichimoku indicator takes a lot of self-discipline, because you have to wait for the best signals to form. It’s best to use the indicator’s default settings and not change them, since they’re built on a well-tested system.
- The relationship between leading line 1 and leading line 2 is used to gauge the strength of the current trend: a small gap between the two lines makes the cloud thin, while a wide gap makes the cloud thick. A thin cloud points to a stronger trend, while a thick cloud points to a weaker one.
Disclaimer: This article is for educational purposes only and does not constitute investment advice. The Ichimoku indicator, like any technical tool, can produce false signals, and past chart behavior does not guarantee future results. Trading forex and CFDs involves significant risk, including leverage risk, and most retail investor accounts lose money when trading these products. Only trade with capital you can afford to lose, and consider seeking independent financial advice before making trading decisions. This article may contain affiliate links; easytradeweb may earn a commission if you open an account through them, at no extra cost to you.