
Doji Candlestick Pattern Explained

The Doji candlestick indicator can help traders who have trouble spotting Doji patterns on a chart.
Keep in mind that a Doji candle signals indecision in the market.
The key is to find this candle at points on the chart that are likely turning points for the market.
It applies in both bearish and bullish scenarios, and it’s a candle worth watching for because it can signal a full change in trend.
Test this indicator without risking capital
Reading about an indicator is not the same as watching it behave on a live chart. A demo account lets you apply the settings above to real market data and see how the signals form before any money is involved.
Advertising disclosure: partner link. Easy Trade may receive compensation. Educational content, not financial advice. CFDs carry a high risk of losing your capital.
How to Use the Doji Candlestick Indicator
Once you have a Doji indicator installed on your chart, it will look like the example on the 1-hour chart for the EUR/USD pair – you can see the small body and long shadows on the highlighted Doji candles.
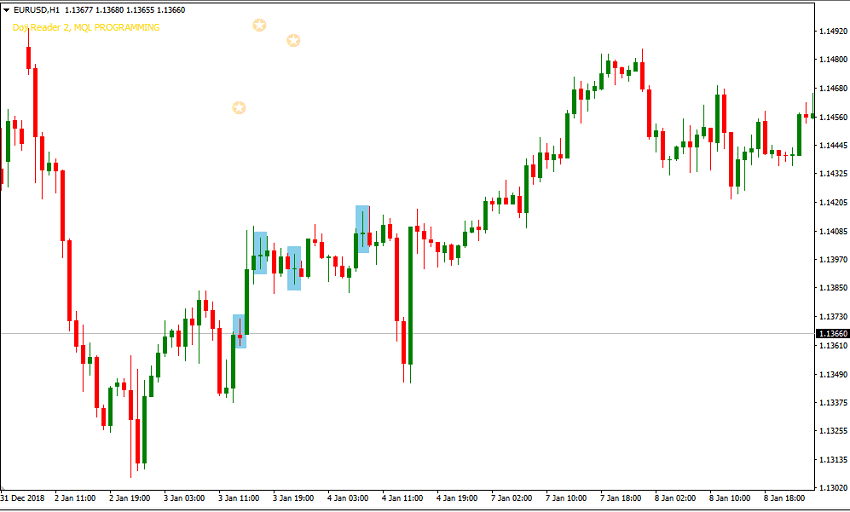
Keep in mind that there’s no single best setting for this indicator – just adjust what matters to you so you can easily spot the marked candles on the chart.
How to Trade Using the Doji Candlestick Indicator
The idea behind the indicator is simply to flag that there’s indecision in the market.

Your trading plan and strategy may benefit from seeing the market as being in a state of indecision.
You can choose to use it to trade price action rather than just as confirmation.
Some traders may use it as a reversal signal and choose a pending order above or below the candle as an entry.
Would you take into account whether you’re trading an uptrend or a downtrend?
If so, you might want to wait and use the Doji candle’s color in the direction of the trend you want to trade.
On balance, the Doji candle is a neutral indicator that offers limited information, so it isn’t a reliable tool on its own for identifying things like price reversals. Even when a Doji pattern does form, it can’t be relied on by itself – there’s no guarantee the price will keep moving in the expected direction after the confirmation candle.
The size of the Doji candle’s tail or wick, together with the size of the confirmation candle, can sometimes mean the entry point for the trade sits too far from the stop-loss level. That means traders may need to choose a different stop-loss position, or may need to skip the trade altogether if the stop-loss size is too large to justify the trade’s potential profit.
Estimating the potential profit of a trade based on a Doji candle can also be difficult, since candlestick patterns don’t usually provide price targets – other techniques, such as additional candlestick patterns, indicators, or strategies, are needed to exit the trade while it’s still profitable.
Disclaimer: This article is for educational purposes only and does not constitute investment advice. The Doji candlestick pattern describes potential price behavior based on past data; it does not guarantee future results, and its indecision signal can fail or turn out to be false. Trading forex and CFDs carries a high level of risk and may not be suitable for all investors, and you can lose more than your initial deposit. This article may contain affiliate links to trading platforms; we may earn a commission if you open an account through them, at no extra cost to you.