
Candlestick Trading Pros Cons

Knowing the secrets of reading trading candles and anticipating trends comes down mainly to practice and experience. To grasp this field you have to try it and go through it yourself. In general, understanding candles lets traders interpret possible market directions and build decisions from those conclusions.
Technical analysis also offers many different tools to help traders identify trends and anticipate their reversals. Alongside technical indicators, another useful way to analyse price action is studying trading candles and their various patterns.
As you may know, there are several ways to display the historical price of an asset, whether a foreign-exchange pair, a company’s stock or even a cryptocurrency. The three most common chart types are the line chart, the bar chart and the candlestick chart. Most traders tend to prefer the last one, because it can show patterns that point to a possible trend reversal or continuation with some degree of reliability.
Trading candles
By definition, trading candles are used to track prices across all financial markets. These markets include foreign exchange, commodities, indices, treasury bonds and the stock market. Stocks make up the largest number of traded financial instruments, and most of the time the prices at which these instruments trade are recorded and displayed graphically using candlestick charts, which are among the most widely used ways of representing prices.
There is no doubt that reading trading candles is one of the core skills every trader should have. By description, each candle represents a specific time frame and gives data on the open, high, low and close of the price during that period. In practice, a standard candlestick is made up of the candle body plus an upper and a lower wick.
The candle body runs from the close price to the open price of the asset for a given period. The tip of the upper wick usually shows the highest price reached during that period, while the lower wick starts at the lowest price seen during the period and rises up to the body. Candles are also either bullish or bearish depending on the direction of the price over the period they are drawn in.
Read also: Trusted brokers in Saudi Arabia, key factors for choosing a broker
Bullish candles
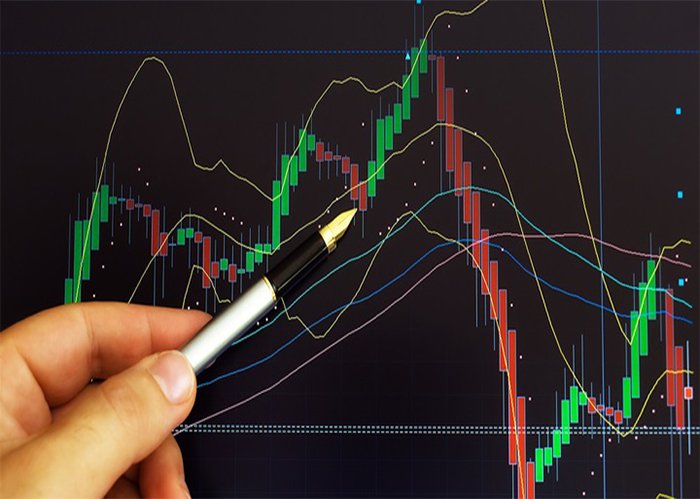
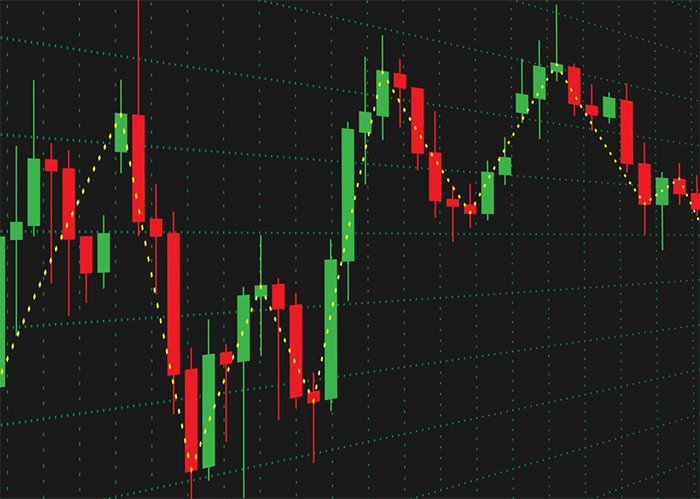
Bullish candles form when the price opens at a certain level and closes at a higher price. This type of candlestick represents a rise in price over a given time frame. The default colour of a bullish Japanese candle is green, though white is also often used.
Bearish candles
Bearish candles form when the price opens at a certain level and closes at a lower price. This candle shows a drop in price. The default colour of a bearish candle is red, but black is also common.
The benefit of trading candles
Trading candles give every trader, seasoned and beginner alike, an easy way to track the price movement of a given security over a set period. Traders can see where price sat at the open and the close, along with the high and the low during the period, and make their trading decisions accordingly.
How do you interpret trading candles?
Once you know what the basic components of a candlestick chart mean, you can easily start looking for different patterns. The different shapes and lengths of candles point to different directions, and any trader should know how to read these patterns.
Is trading candlestick patterns a good idea?
It is important to remember that candlestick chart pattern analysis has become more popular than ever with both retail traders and high-powered equity players such as hedge funds. Large-scale investors are often able to execute automated trades very quickly based on algorithms that try to predict what smaller traders are likely to do, so not every candlestick pattern is as reliable or as useful to the day-to-day investor as it once was.
Candlestick patterns can look slightly different each time they appear, and they do not always produce the same results. Before trading based on candlestick patterns, it is important to practise identifying them and to review the outcomes with hindsight. Managing a virtual portfolio, that is, trading stocks with pretend money, is one good way to practise trading candlestick patterns without risking any real capital.
Read also: How do I start trading currencies? Plans and strategies
How do you use candlestick patterns?
Naturally, there are a large number of candlestick patterns for pinpointing the area of interest for a given period on the chart. In practice, these candles are used to open long-term positions, day trades and trades on swings in a currency’s value. Some patterns also let traders understand the balance between buyers and sellers, while others can indicate a trend reversal in the market, a continuation, or hesitation among market participants.
Because they are common, every trader or investor needs to understand that candlestick patterns do not give a direct signal to buy or sell a particular currency. Instead, they offer a way to look more deeply into market structure and the possible signals for the near future. In any case, it is best to read such patterns in their own context, which may be the context of the technical setup on the chart, as well as the wider market environment and many other factors.

What are the advantages of trading candles?
Lots of information
Because trading candles show the highs, lows, open and close for a given time frame, they are one of the most detailed and clear chart types, presenting the data in an attractive, easy-to-understand way.
Easy to understand
Trading candles are visually pleasant to look at on screen, with customisable colours and charts available on most charting platforms, and any user can make candlestick charts look however they like.
Indicators work better
One genuinely useful point is that most indicators work better with Japanese candlestick charts. If the indicators are tied to a particular trading system, candlestick charts are often required.
Read also: Types of the forex market, what they are and how they work
Algorithms
Japanese candles are clear, simple and easy to describe. This certainly makes them easy to write in code to build trading algorithms that use technical analysis.
Disadvantages of trading candles
Hard to master
Reading trading candles can be classed as a simple type of market analysis, and it will take a trader several hours to learn and apply it in practice. Still, if you use Japanese candlestick charts consistently to analyse the market, you will be able to master them properly over time.
Unknown movements
Unless you are watching a bar form in real time, in hindsight the trader has no idea what came first. The trader has to drop down to lower time frames to see what happened inside that candle. A single bullish bar on a higher time frame may represent a full trend on lower time frames, or it may represent a single equivalent move, so we will not know unless we sit and watch the candle form or zoom in on smaller time frames.
Gaps
Trading candles, in all their patterns, often come with gaps, and there may be cases where one candle closes at a certain level and the next candle opens at a different level.
Analysis paralysis
Trading candles with their various patterns can show many biases, as technical analysis stays non-objective and can create conflicting signals, especially when indicators are added.
Read more: Trading currencies with no deposit, a safe option. Investing in forex, getting started.
Try this strategy on a demo account first
A strategy that looks clear in an article can behave very differently under real spreads and volatility. Testing it on a demo account shows you how it performs before you commit any capital.
Advertising disclosure: partner link. Easy Trade may receive compensation. Educational content, not financial advice. CFDs carry a high risk of losing your capital.
Disclaimer: This article is for educational purposes only and is not investment advice or a recommendation to trade. Candlestick patterns describe past price action; they do not predict future results, and signals can fail. Trading forex and CFDs on margin carries a high level of risk due to leverage and can result in the loss of your entire capital. Only trade with money you can afford to lose, and seek independent advice if needed. Some links on this site may be affiliate links, and we may earn a commission at no extra cost to you.