
What Is the Hanging Man Pattern?

The hanging man is a type of Japanese candlestick pattern. Candlesticks show the high, low, open, and close prices for a set time frame. Related reading: Sushi Roll Pattern.
Candlesticks also reflect the effect of traders’ transactions and sentiment on security prices, and some technical traders use them to time entries and exits from trades with precision.
What Is the Hanging Man Pattern?
The term “hanging man” refers to the shape of the candle, as well as to what this pattern’s appearance suggests: a hanging man represents a possible reversal in an uptrend, turning it into a downtrend.
Selling an asset based on the hanging man pattern alone is a risky move, but many traders treat it as a key piece of evidence that market sentiment has begun to shift and that the uptrend’s strength is fading.
See also: What is the inverted hammer pattern?
Identifying the Hanging Man Pattern
A hanging man pattern occurs when two main criteria are met: the asset must be in an uptrend, and the candle must have a small real body (the distance between open and close), a long lower shadow, and no upper shadow at all.
Given these two criteria, when a hanging man forms in an uptrend, it signals that buyers lost their strength while demand was pushing the price higher, and that heavy selling took place that day.
While buyers managed to bring the price back close to the opening price, that selling is a sign that a growing number of investors believe the price has peaked, reached overbought levels, and will fall soon.
This pattern gives traders a chance to sell the asset for a longer position, or even a short-term one, in anticipation of a price decline.
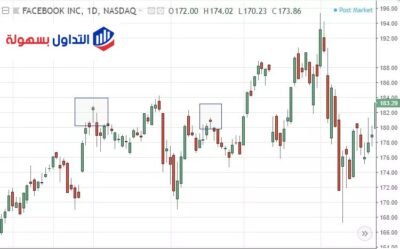
The chart below shows two hanging man patterns, both of which led to at least short-term downward moves in price. The asset’s long-term trend was not affected, because the hanging man pattern is only useful for gauging short-term momentum and price changes.
While traders often rely on candlestick formations to spot moves in individual assets, it also helps to look for trading signals from indicators, support, and resistance to pin down stronger price zones.
Candlesticks can also be used to track momentum and price action in other asset classes, including currencies or futures.
See also: Butterfly pattern | identifying the end of a trend move
Distinguishing Features of the Hanging Man Pattern
For a hanging man pattern to be valid, the lower shadow should be at least twice the length of the body. In other words, traders want to see a long lower shadow to confirm that sellers stepped in with force at some point while that candle was forming.
Thomas Bulkowski’s “Encyclopedia of Candlestick Charts” notes that the longer the lower shadow, the clearer the pattern.
Historical market data backs up the strength of the hanging man pattern. In most cases, these long-shadow patterns outperformed those with shorter shadows, so some traders also look for strong trading volume alongside the shape.

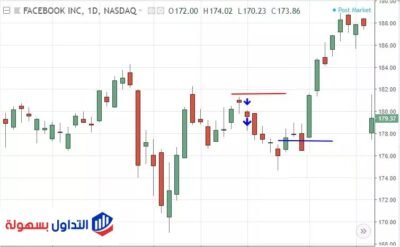
Another distinguishing feature is a confirmation candle on the day after the hanging man appears. Since the hanging man only hints at a possible price decline, the signal needs to be confirmed by a lower close the next day.
That confirmation can come through a lower gap, or simply the price moving the next day to a close below the hanging man’s close. According to Bulkowski, such events warn of a further price reversal of up to 70% of the current price swing.
The color of the hanging man’s real body does not matter much, whether green or red. What matters is that the real body stays relatively small compared to the lower shadow.
Trading a Red Hanging Man Candle
Hanging man patterns with above-average volume, a long lower shadow, and a bearish candle right after them give the price its best chance of moving lower, which makes them well suited to short setups.
When you spot a hanging man pattern, consider opening a sell position near the close of the day following the hanging man. The stronger approach is to place the trade near the hanging man’s closing price or near the next candle’s open.
Place a stop-loss order above the top of the hanging man candle. Chart examples of this setup show the possible trade entries alongside stop-loss placement.
One limitation of candlestick patterns is that they don’t provide price targets. Stay in the trade while downward momentum holds, and exit once the price starts climbing again — the hanging man is only a short-term reversal signal.
The hanging man pattern appears during an uptrend and warns that prices may start to decline. It consists of a small real body, a long lower shadow, and little to no upper shadow. The hanging man also shows that selling pressure is starting to build, but for the signal to hold, the candle right after the hanging man needs to close lower.
Best Types of Japanese Candlestick Patterns
See also: Explaining the best 9 candlestick patterns to master in trading
Frequently Asked Questions
What is a reversal candle?
A reversal candlestick pattern is a candlestick formation arranged in a way that signals the end of an existing trend in favor of the opposite direction.
What do Japanese candlesticks mean?
A Japanese candlestick is a type of price chart that shows the open, close, high, and low prices for each given time period.
What does a doji candle indicate?
A doji candlestick indicates indecision between buyers and sellers, so a doji pattern can be read as a possible trading-opportunity signal. Several types of doji candles can appear on a candlestick chart.
What is the hanging man candle?
The hanging man candle occurs during an uptrend and warns that prices may start to decline. It consists of a small real body, a long lower shadow, and little to no upper shadow. The hanging man shows that selling pressure is starting to build.
Test this indicator without risking capital
Reading about an indicator is not the same as watching it behave on a live chart. A demo account lets you apply the settings above to real market data and see how the signals form before any money is involved.
Advertising disclosure: partner link. Easy Trade may receive compensation. Educational content, not financial advice. CFDs carry a high risk of losing your capital.
Disclaimer: This article is for educational purposes only and is not investment advice. Candlestick patterns such as the hanging man are one input among many and do not guarantee any future price movement. Trading forex, CFDs, and other leveraged instruments carries a high level of risk and may not be suitable for all investors. This page may contain affiliate links, meaning easytradeweb.com may earn a commission if you open an account through a link on this page, at no extra cost to you.